Here are a few quick steps to get your environment ready for today's exercises.
Step 1. Turn on Metric Ingest in the Dynatrace UI
- Navigate to Settings > Monitoring > Monitored Technologies
- Scroll down to the bottom of the list
- Turn on Dynatrace OneAgent StatsD, Pipe, HTTP Metric API
Step 2. Create a Dynatrace API token with Metric Ingest permission
- Navigate to Settings > Integration > Dynatrace API > Generate Token with Ingest Metrics toggle on
- Copy and save the token in a secure place
Step 3. Set up a browser monitor in the Dynatrace UI
- Navigate to Synthetics > Create a Synthetic Monitor
- Create a browser monitor against Dynatrace Home Page
- Ex: https://dynatrace.com
- Monitor Name: Dynatrace Home
- Leave all other defaults and select 3 locations
Step 1. Download and install the latest release of Telegraf from https://portal.influxdata.com/downloads/
- Telegraf is written in Go, so there are no dependencies for the agent
- Note: Plugins that run on top of Telegraf may have dependencies
wget https://dl.influxdata.com/telegraf/releases/telegraf-1.18.0-1.x86_64.rpm
sudo yum localinstall telegraf-1.18.0-1.x86_64.rpm
Step 2. (Optional) After the installation is complete, navigate to https://github.com/influxdata/telegraf
- Navigate to plugins folder
- Take a look at the different types of input plugins available
- Take a look at the different types of output plugins available
- Any notable absentees in the output vendor list?
Step 3. Let's configure Telegraf to send data to Dynatrace
- Navigate to Telegraf config folder and edit telegraf.conf file
cd /etc/telegraf/
sudo vi telegraf.conf
Let's tell telegraf where to send the data - documentation here https://www.dynatrace.com/support/help/shortlink/telegraf
- Find
outputs.dynatracewithin the conf file and enable it by deleting the # at the beginning of the line - Uncomment ‘url' and add your Dynatrace environment URL with /api/v2/metrics/ingest appended at the end of the URL
- Uncomment ‘api_token' and add API token from previous excercise
- Finally, uncomment ‘prefix' parameter and leave "telegraf." - this helps us search metrics from telegraf easily within Dynatrace
By default, basic infrastructure metrics such as disk, memory and CPU should be enabled. Confirm by checking inputs.cpu, inputs.disk are uncommented
- Uncomment those plugins if they're not already enabled
- Save and close the conf file
Step 4. Let's start Telegraf service
sudo service telegraf start
Step 1. Clone Git Hub Repo
- In the DTU terminal
git clone https://github.com/JasonOstroski/Perform2021-ActionableInfraScripts.git
Exercise Prep: CPU Temp
Let's generate some data for some later exercises
Kick off the CPU Temp Script
- In the DTU Terminal run the following
(ubuntuvm)$ cd Perform2021-ActionableInfraScripts
(ubuntuvm)$ python3 cputemp.py
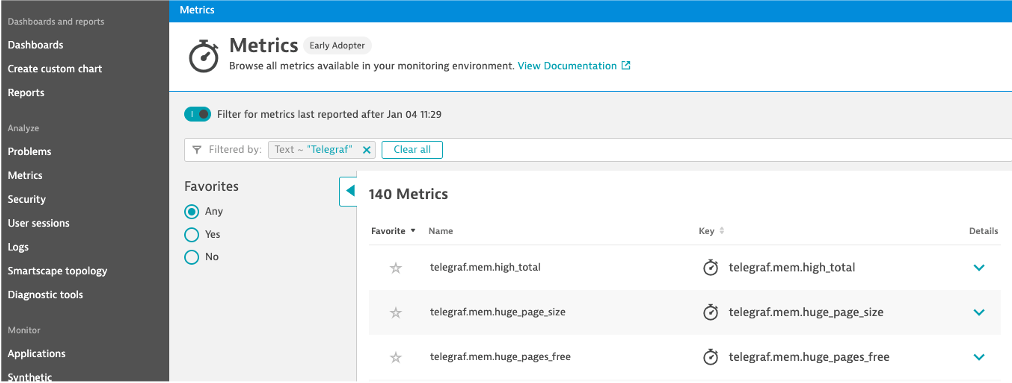
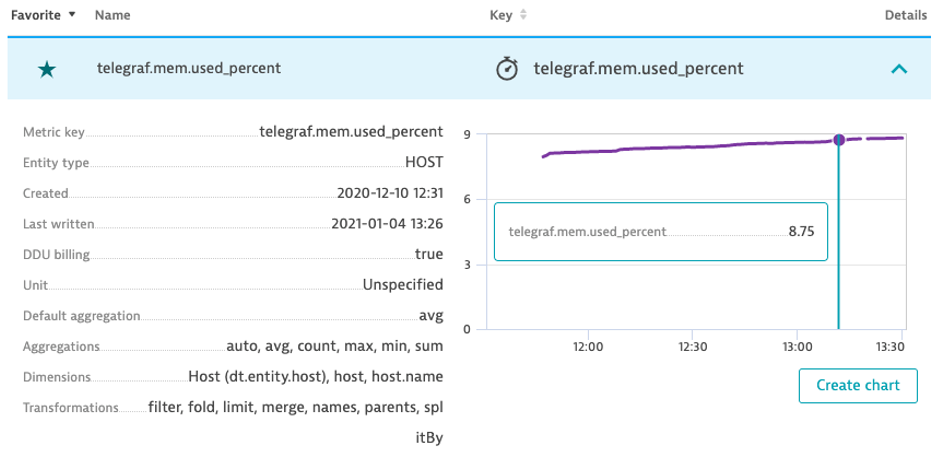
Metric Browser
- Search for Metric by name
- Example: Telegraf.mem.used_percent
- Favorite the Metric
- Which dimensions are available?
- Create Chart and pin into a new dashboard
- Give the dashboard a meaningful name
- Ex: Infrastructure Overview
- Tile Name: Memory Utilization
Metric Browser vs Explorer
- Metric Explorer
- Create Custom Chart > Try it out
- Search for the CPU System Usage Telegraf Metric
- Pin the CPU System Usage Telegraf Metric to the dashboard
- Which way was easier, browser or explorer?
- Why would you choose one over the other?
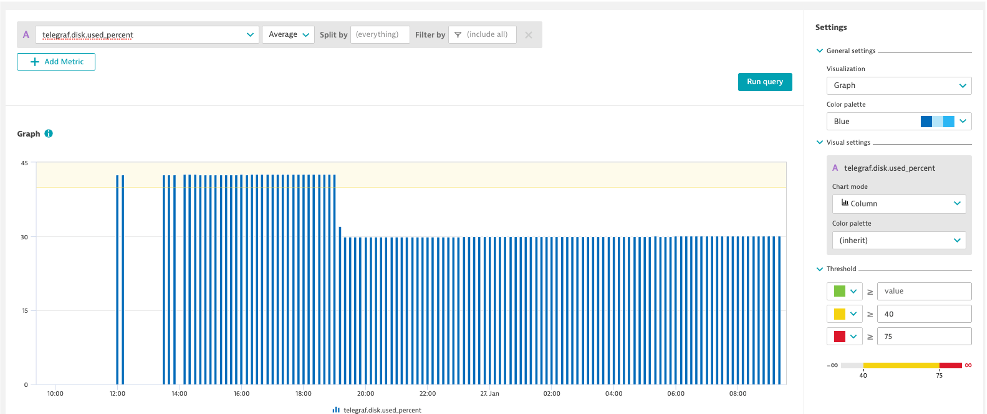
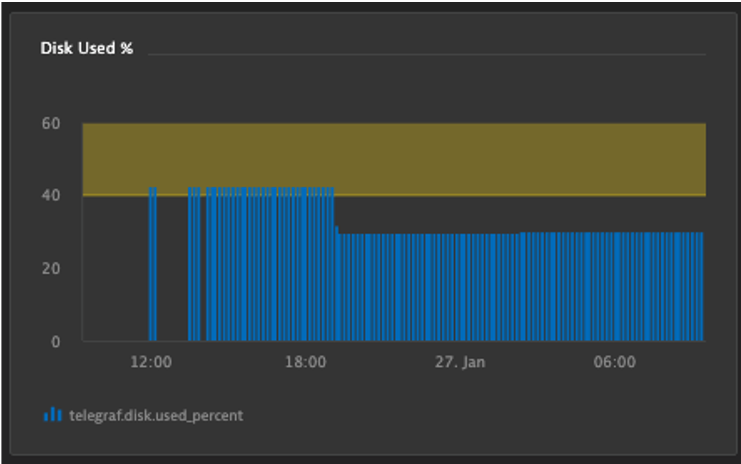
Thresholds
Disk Used Threshold Chart
- Chart the Telegraf Disk Used Percent Metric in the Explorer
- Aggregation: Average
- Thresholds: Green: Blank, Yellow: 40, Red: 75
- Chart Mode: Column
- Pin to dashboard
- Tile name: Disk Used %
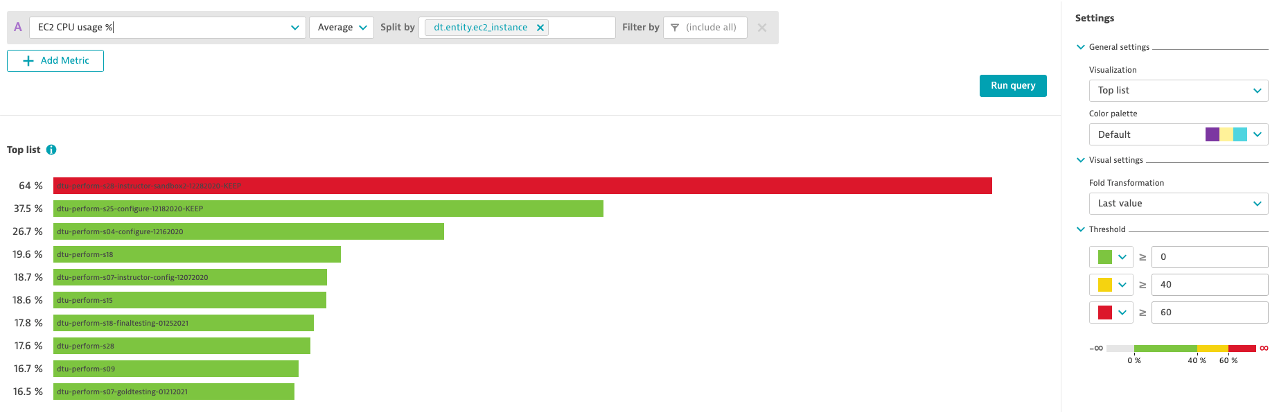
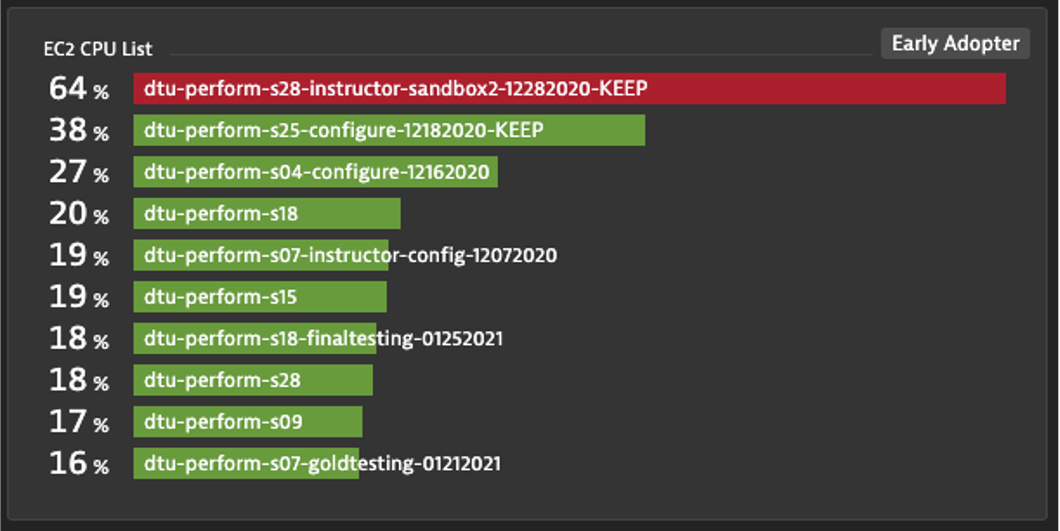
Top List with Thresholds: EC2 CPU
- Create a Top List with EC2 CPU Usage %
- Aggregation: Average
- Split by: de.entity.ec2_instance
- Fold Transformation: Last
- Thresholds: Green: 0, Yellow: 40, Red: 60
- Pin to dashboard
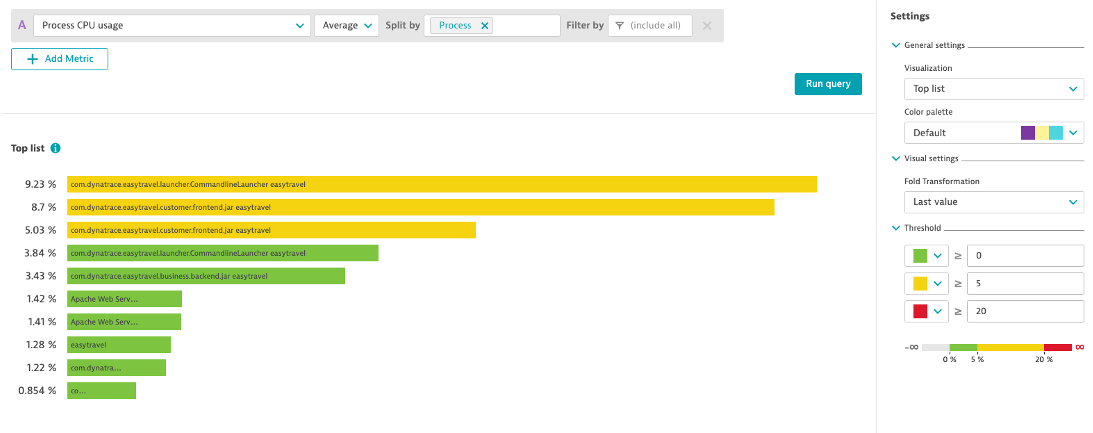
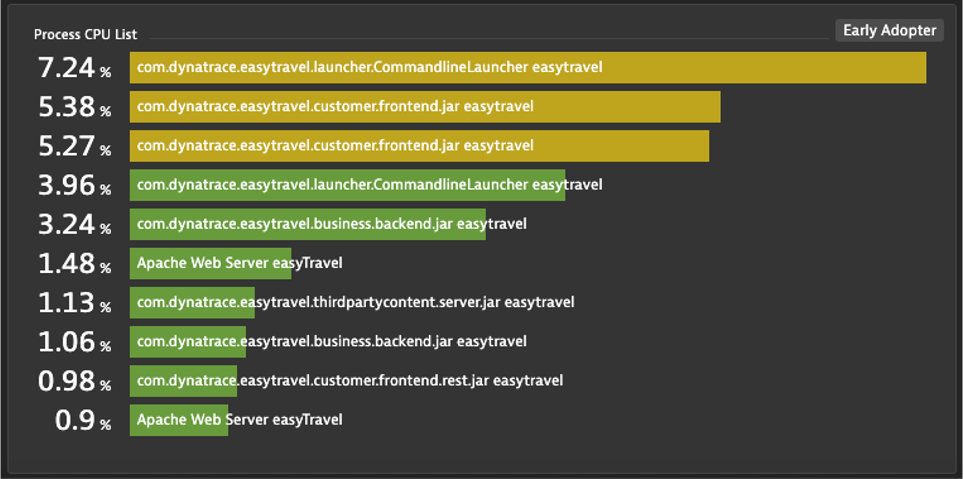
Optional: Top List with Threshold: Process CPU
- Create a Top List with Process CPU Usage
- Aggregation: Average
- Split by: Process
- Fold Transformation: Last
- Thresholds: Green: 0, Yellow: 5, Red: 20
- Pin to dashboard
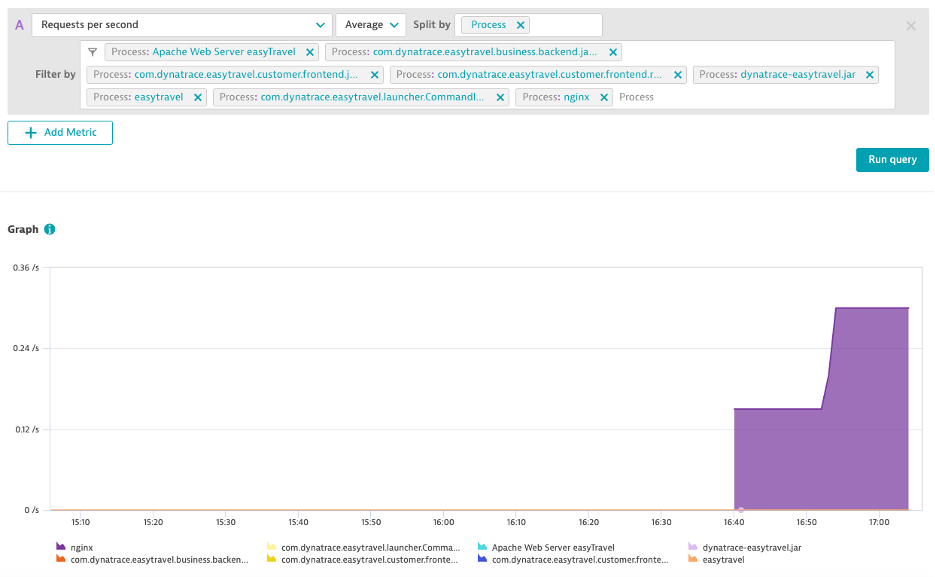
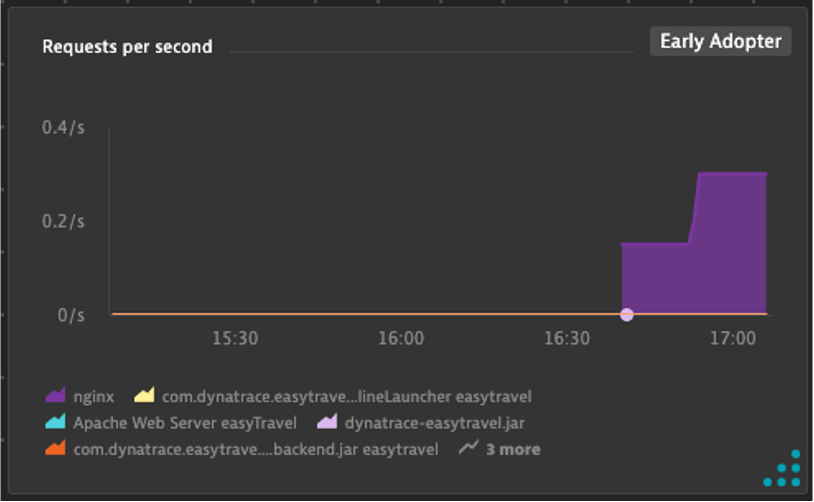
Splitting and Filtering
Splitting
- Create an area chart with Process Network Load
- Metric: builtin:tech.generic.network.load
- Aggregation: Average
- Split by: Process
- Filter: Only show EasyTravel Processes and Nginx
- Pin to dashboard
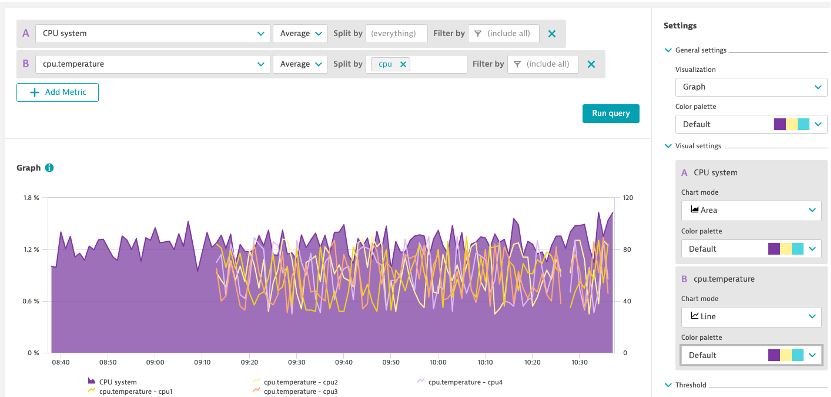
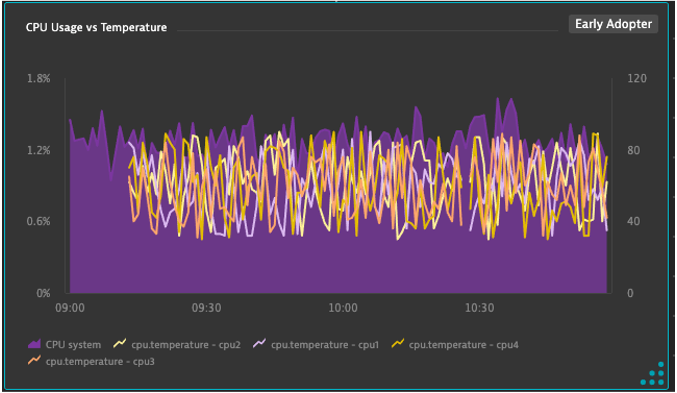
CPU Temp Split
- One of out servers is running high on CPU temp and we want to review the CPU temp vs usage
- Create an area chart with CPU System Usage
- Metric: builtin:host.cpu.system
- Aggregation: Average
- Create a line chart with CPU Temp
- This data comes from the script we started a few exercises back
- Metric: cpu.temperature
- Aggregation: Average
- Split by: CPU
- Pin to dashboard
Exercise Prep: Shop Response Time
Stop CPU and start shop response time
- Back in the DTU Terminal
- Stop the cpu temp script with Ctrl + C
- Start the retail shop response time script
(ubuntuvm)$ python3 retailresponsetime.py
Dashboarding
Let's clean up the Infrastructure Overview dashboard
- Add Tags: Infrastructure, Ops
- Favorite the dashboard
- Add Tiles: Host Health, Problems
- Headers: Overview, Shop Performance, Infrastructure Detail
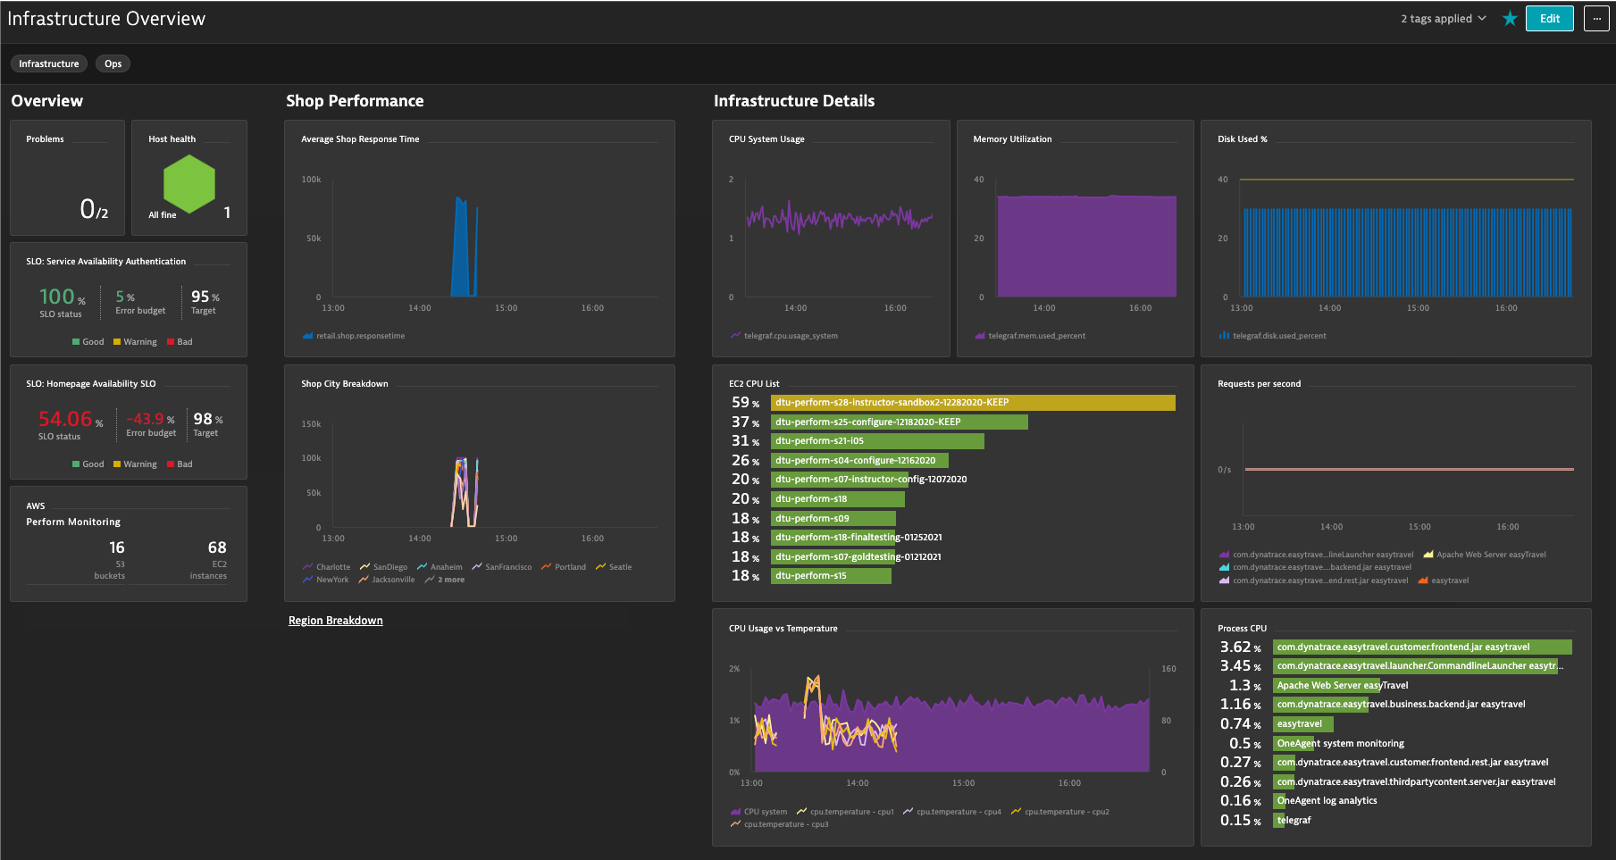
Shop Performance
Create an area chart of average response time
- Metric: retail.shop.responsetime
- Aggregation: Average
- Pin to Infrastructure Overview dashboard
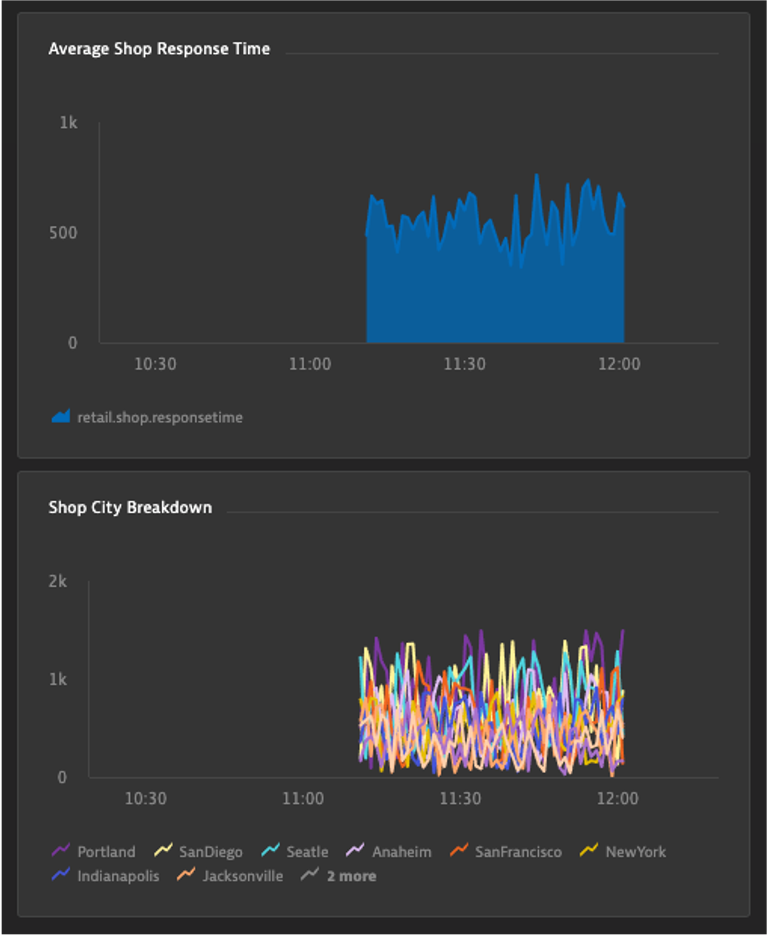
Create a line chart, breaking down the response time by city
- Aggregation: Average
- Split by: city
- Pin to Infrastructure Overview dashboard
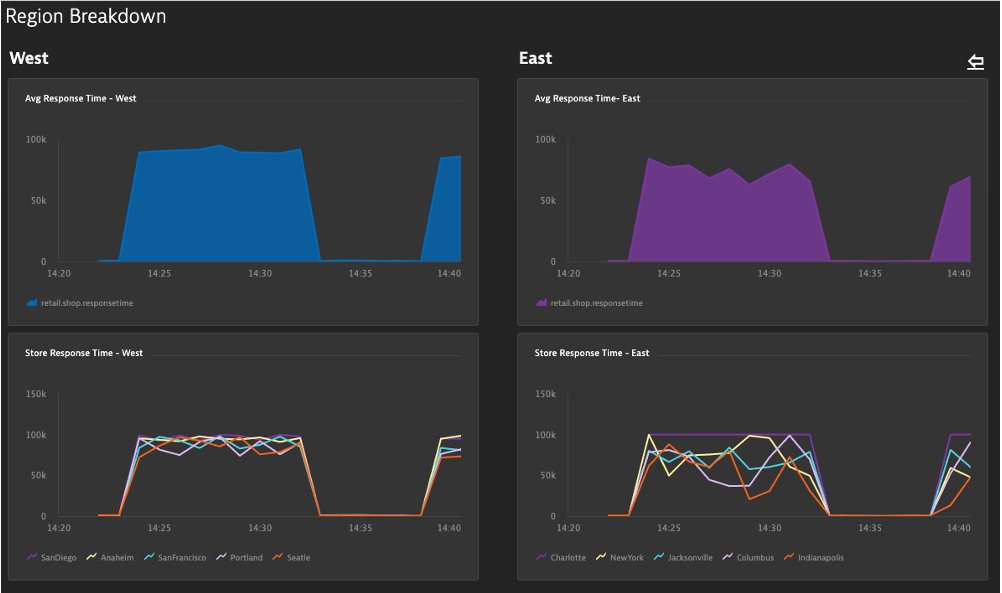
Optional Exercise: Shop Performance Dashboard
- Create a 2nd Dashboard called Shop Performance to highlight East vs West Shop Performance
- Track East and West response times in different tiles of the dashboard
- Metric: retail.shop.responsetime
- Aggegration: Average
- Split By: City
- Filter by: Region useast or uswest
- Create a mark down link from the Infrastructure Overview dashboards
- Create a mark down link from the Shop Performance Dashboard back to the Infrastructure Overview dashboard
- Mark down example:
[Region Breakdown](#dashboard;id=4e0089b5-8f38-4e8f-949f-1113acf79f5c) - Mark down back button example:
## [⇦](#dashboard;id=bbbbbbbb-0008-0000-0000-000000000000)
- Where do I get the id values from?
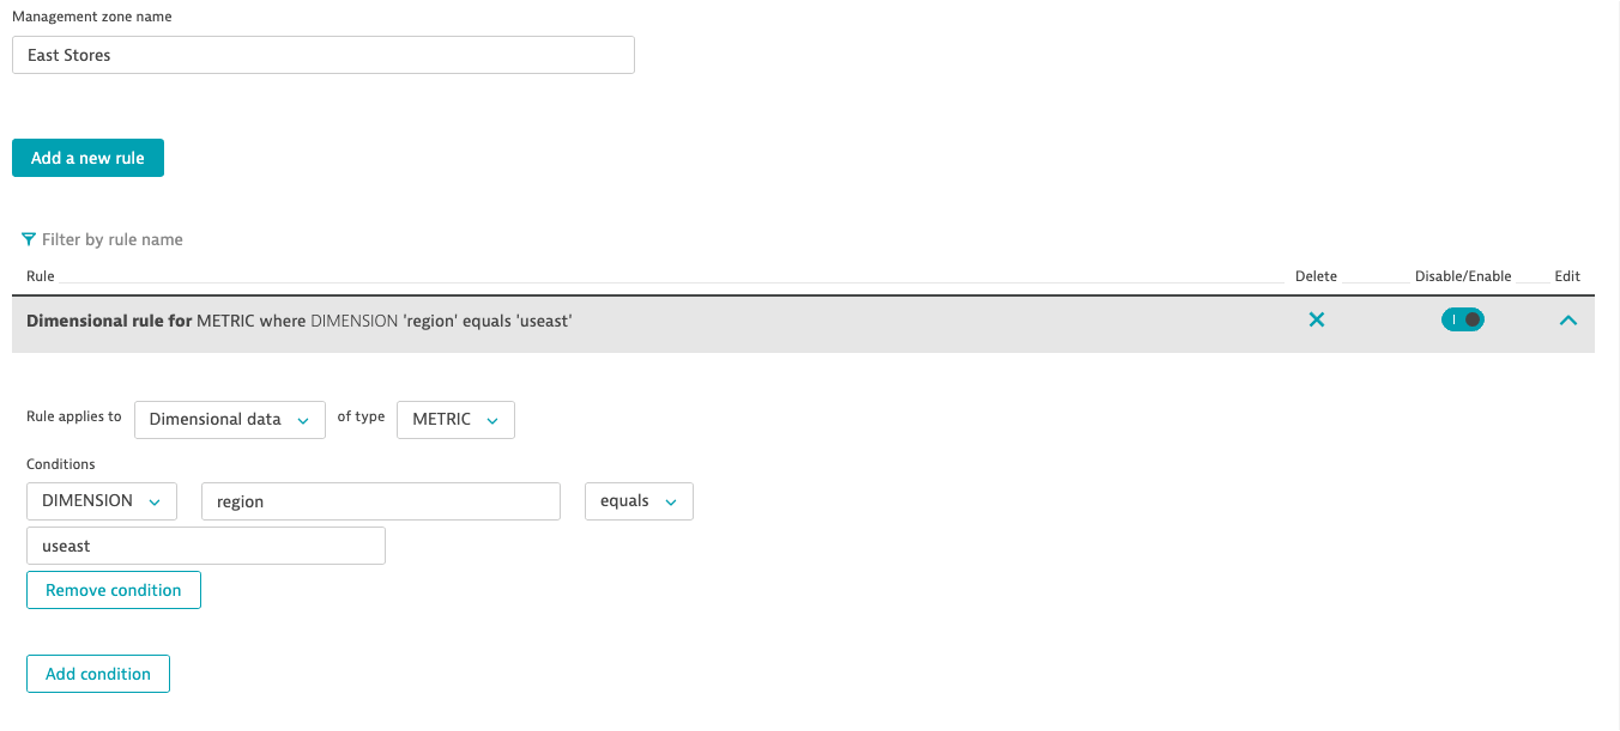
Creating a dimension mananagement zone
- Look at the retail.shop.responsetime metric in the metric browser and gain insights on available data dimensions
Scenario
- You have different IT teams for East and West stores
- Each team only wants to analyze their region's performance
- Create 2 different management zones to cover this
- Add the required management zone rules (Dimensional data rules)
- What happens to the shop tiles in the dashboards when you select the different management zones?
- Explore this in the Metric Explorer too!
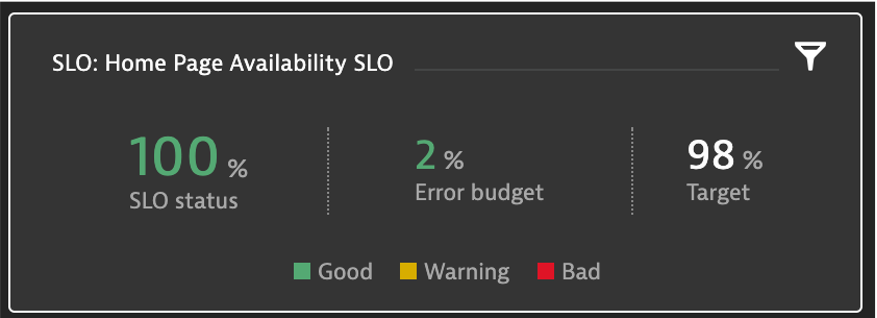
Synthetic SLO
Create a synthetic availablity SLO
- Name: Homepage Availability SLO
- Use existing percentage Toggle
- Metric: builtin:synthetic.browser.availability.location.total
- Evaluation Type: Aggregate
- SLO Filter: type("SYNTHETIC_TEST"),entityName("Dynatrace Home")
- Target Percentage: 98%
- Warning Percent: 99%
- Timeframe: -1d
- Where do I get Metric Name from?
- Where do I get SLO Filter from?
- Add to Dashboard via SLO page pin icon
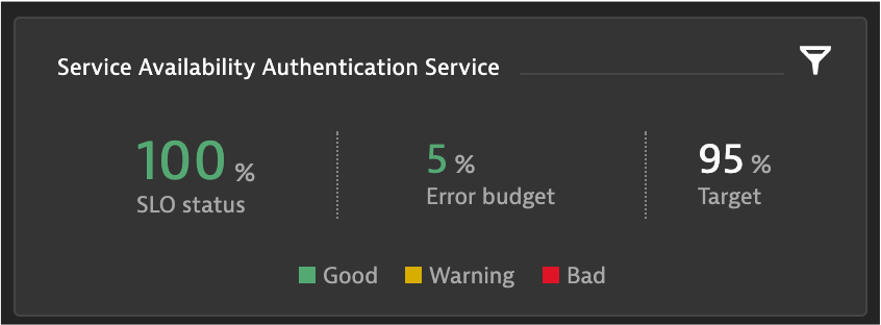
Service Availablity SLO
Create a Service Availablity SLO
- Name: Service Availability Authentication
- Count of success metric: builtin:service.errors.server.successCount
- Total count metric: builtin:service.requestCount.server
- Evaluation Type: Aggregate
- SLO Filter: type("SERVICE"), entityId("SERVICE-12345XYZ")
- Where do I get the entityId from?
- Target percentage: 95%
- Warning percentage: 97.5%
- Timeframe: -1d
- Add it to the dashboard from the dashboard editor
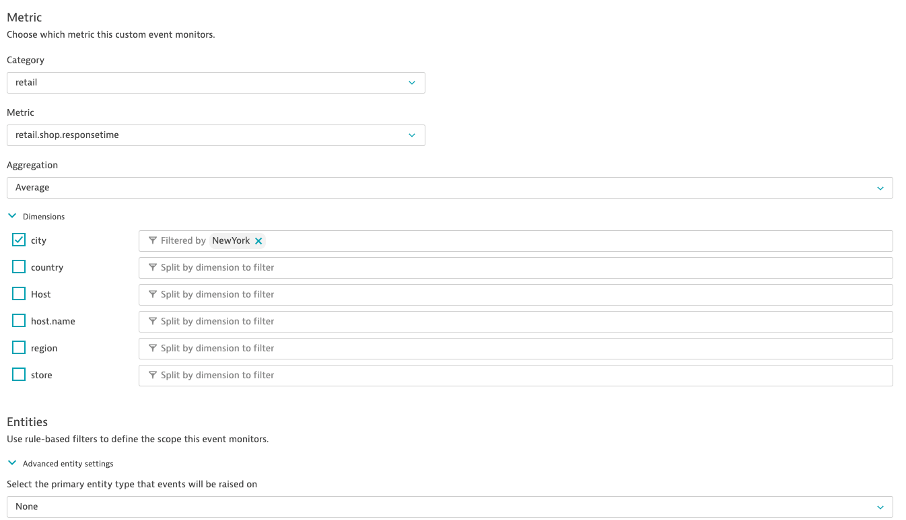
Auto-Adaptive Baselines
Create an auto-adaptive baseline alert for shop response time
- Navigate to Settings > Anomaly Detection > Custom Events for Alerting
- Create an auto-adaptive baseline
- Metric: retail.shop.responsetime
- Aggregation: Average
- City: NewYork
- Entity: None
- Alert of anomalies of 1 time the normal signal fluctuation.
- Metric is above baseline for 1 minute during any 5 minute period
- Name: New York Response Time
- Severity: Slowdown
Static Thresholds
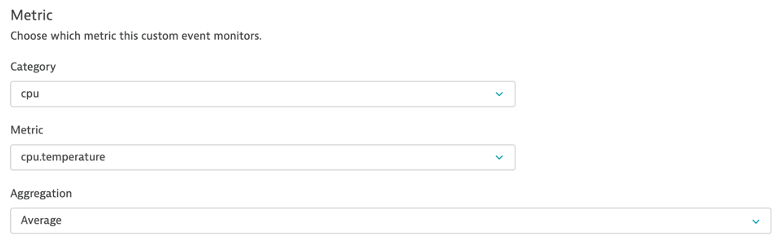
Create a Static Threshold on CPU Temp
- Navigate to Settings > Anomaly Detection > Custom Events for Alerting
- Metric: cpu.temperature
- Aggregation: Average
- Entity: Host
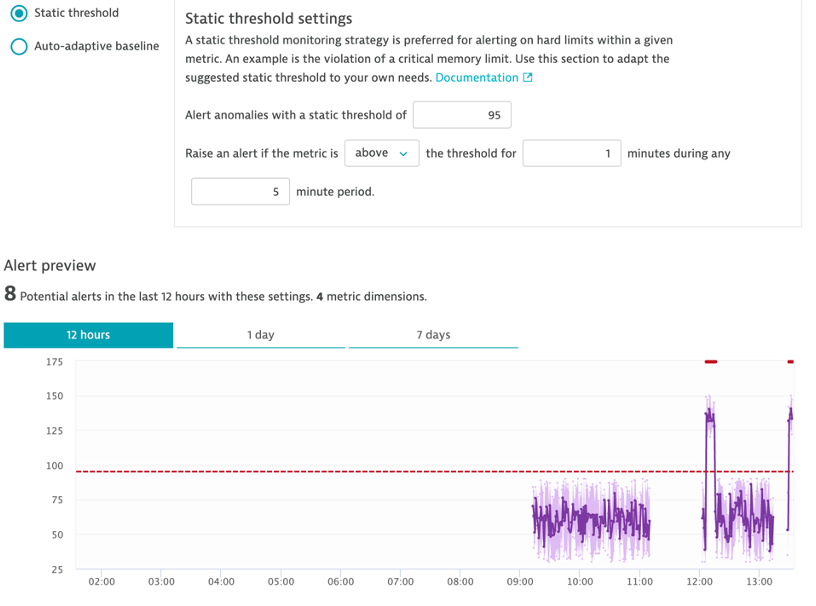
- Static Threshold: 95
- What's the recommended threshold?
- Raise if above threshold for 1 minute during 5 minute period
- Review the Alert Preview
- What happens if you change the threshold to 85?
- Change back to 95 after review
- Title: CPU Temperature
- Severity: Resource
Let's turn up the heat!
- Back in the DTU Terminal
- Stop the retailresponsetime.py script if it's still running (Ctrl + C)
- Start the retail script:
(ubuntuvm)$ python3 cputemp.py HHMM 10
- HHMM is the time you'd like the CPU scenario to start
- Start it a few minutes after the current time
- You can run timedatectl to check current time
- Ex: 1828 is 1:28 PM EST or 18:28 UTC
- 10 is the number of minutes you'd like the scenario to run for
- Wait a few minutes and let's see the problem!
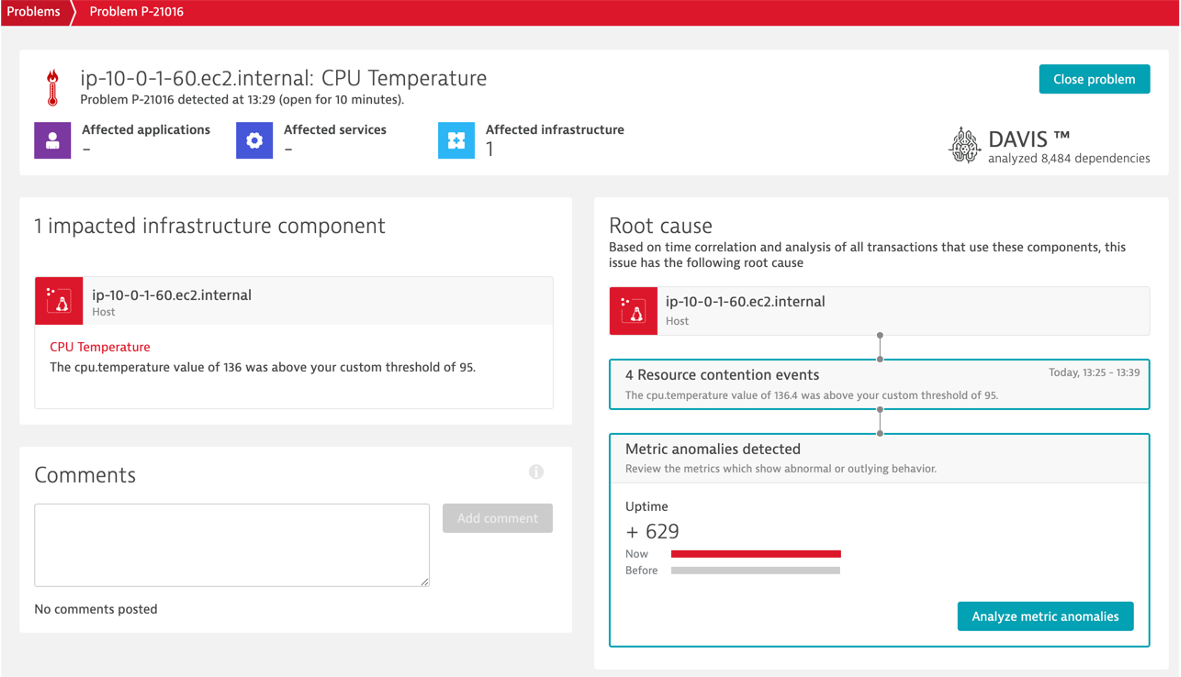
Problem Evaluation
- Review the problem ticket
- Drill into the host and view the events
Create an API Token
- Settings>Integration>Dynatrace API
- Generate Token, name it, and turn on:
- API v1 - Access problem and event feed, metrics, and topology, Read Configuration, Write Configuration, User Sessions
- API v2 - Read Metrics
- Copy the value and store in a safe place
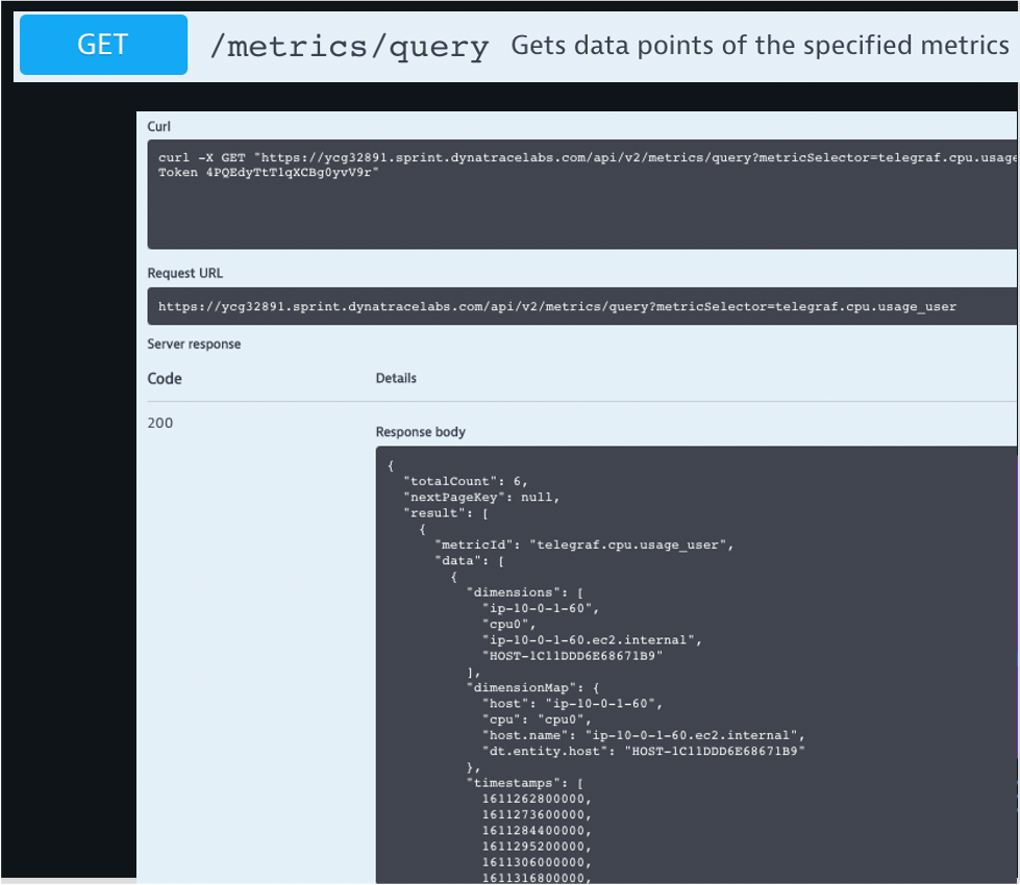
- Navigate to the API Explorer: Environment API v2
- Authorize and paste in API Token
- GET /metrics/query
- Metric Selector: telegraf.cpu.usage_user
- View available options and output
Postman Prep
Create a workspace: PerformHOT2021
- Import from RAW Text
- Open a new browser tab: https://github.com/JasonOstroski/Perform2021-ActionableInfraScripts/
- View Raw of metrics_api_postman_collection.json
- Copy the entire text and paste into Postman
Postman
- Let's get data from the Dynatrace Metric API!
- For the CPU and Disk GET Requests:
- Replace {{URL}} in GET with your Dynatrace Environment
- Be mindful that it's easy to copy and paste https:// and it's already in the GET
- Replace {{API_TOKEN}} in the header with your API Token
- You can also do the replacements via Postman environments
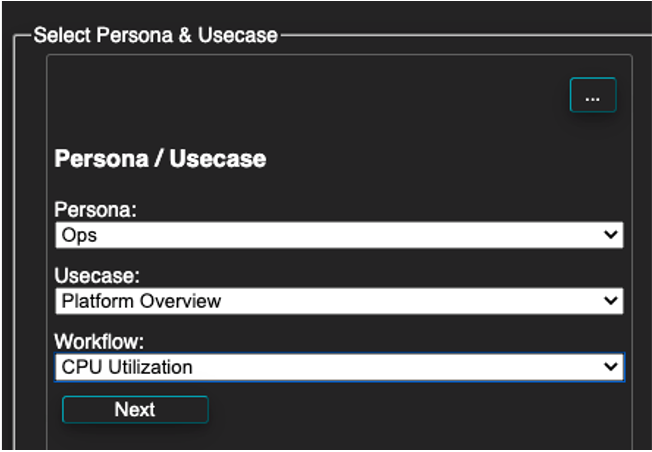
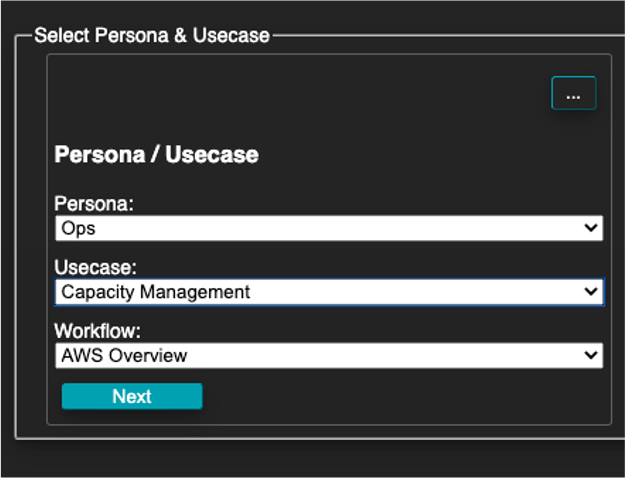
Let's add some more dashboards!
- https://dynatrace.github.io/BizOpsConfigurator
- Enter your tenant URL and API Token
- Deploy Ops, Platform Overview CPU Utilization (no diamond)
- Deploy Ops, Capacity Management, AWS Overview
- Deploy Ops, AIOps, Dashboard Basics
- Deploy any other dashboard templates you want to try out.
- Navigate back to the Dynatrace UI and see the new dashboards!
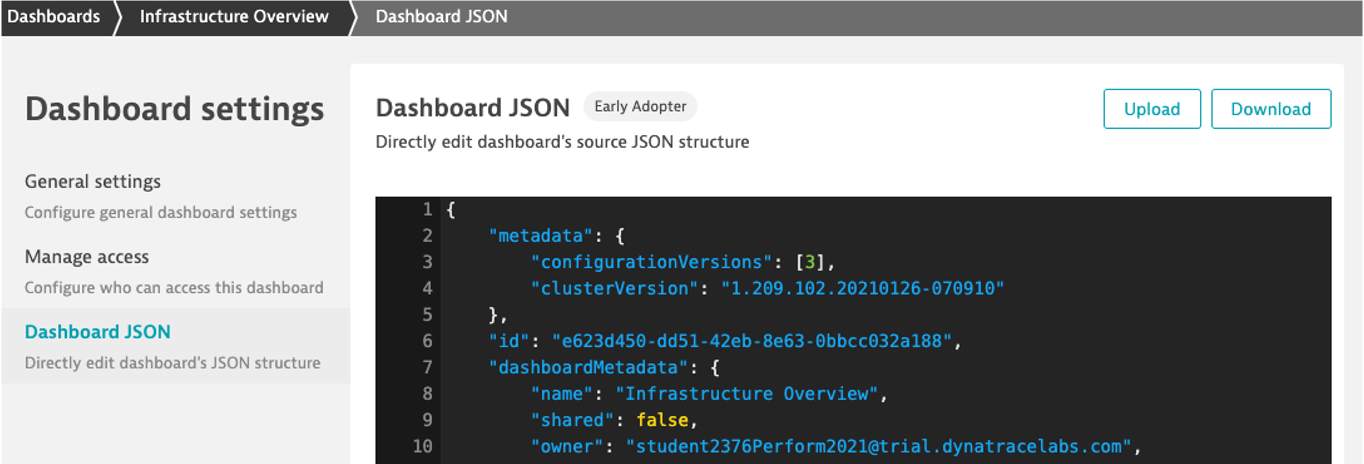
How can I bring my dashboard home with me?
- Go to your Infrastructure Overview dashboard
- Click ... Button in upper right corner > Share > Advanced Settings
- Click dashboard JSON > Download
- This is also available in the Configuration API for managing dashboards at scale