This repository contains labs for the Hands-On Autonomous Cloud Session. We will be providing the necessary details for your to access your environment.
For the purposes of the Hands-On, we will automate and make the steps seamless for the participants
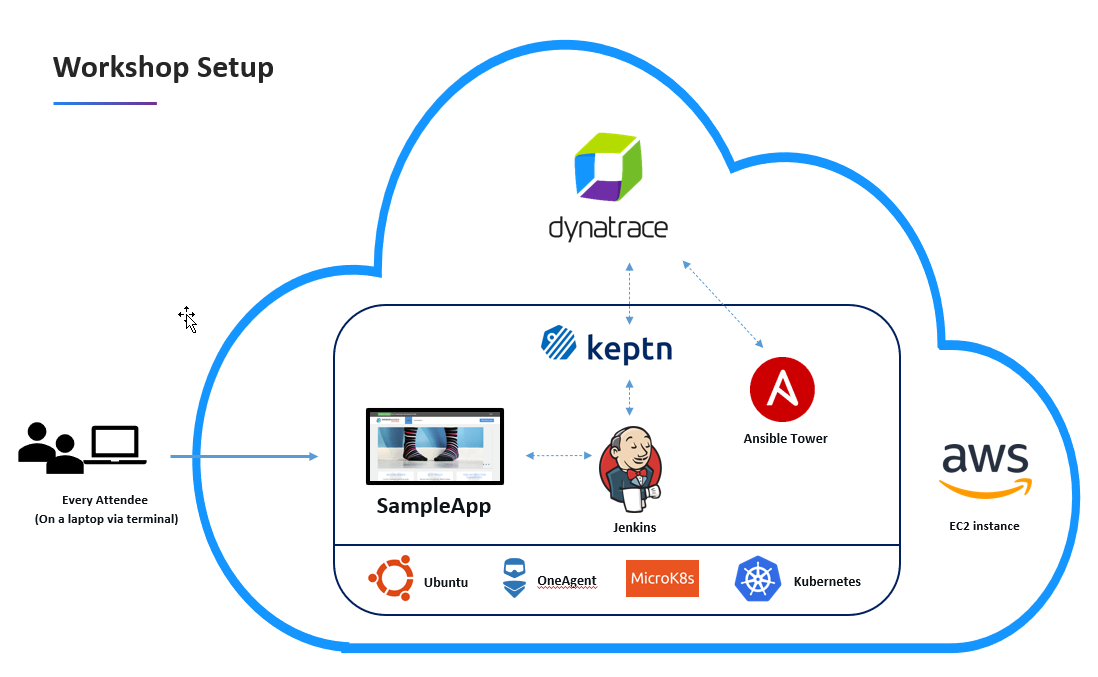
You will be provided with the following:
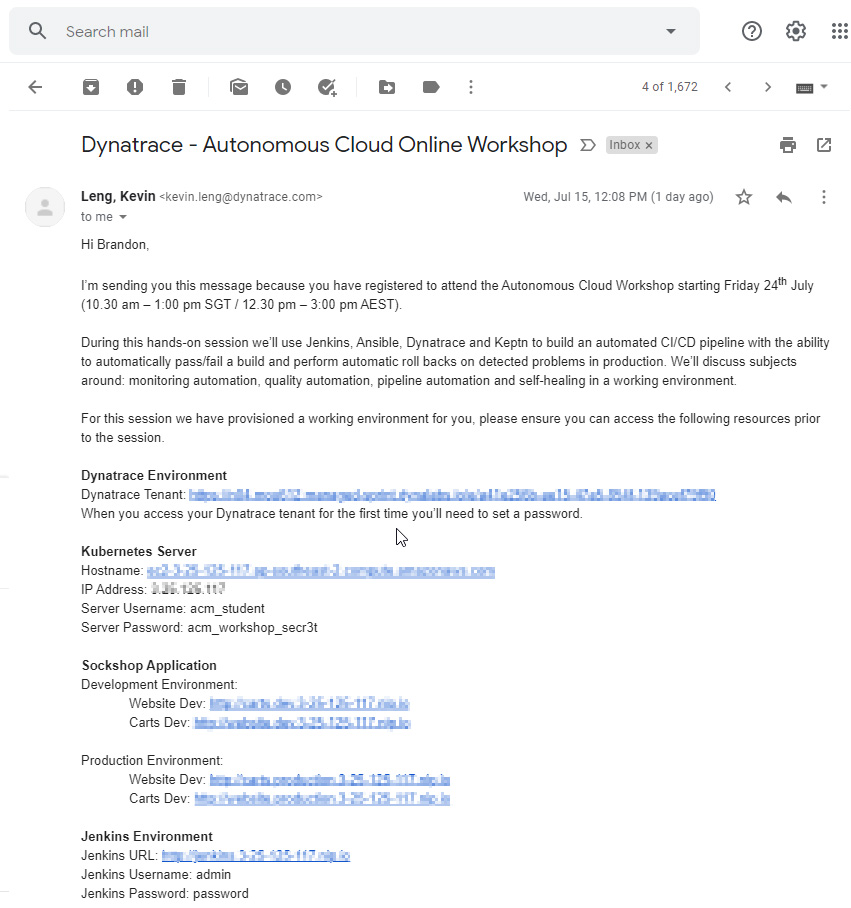
- Dynatrace environment
- Kubernetes Server running
- Sockshop Application (sample app)
- with Dev and Prod Environments
- Sockshop Application (sample app)
- Jenkins environment
- Ansible environment
Prerequisites
- Chrome Browser
- Autonmous Workshop Email with credentials
What You'll Learn
- Deploy a pipeline (Sockshop) in Jenkins
- Installing Keptn
- Integrating Jenkins to Keptn and Dynatrace
- Using Jenkins + Keptn with Dynatrace for
- Automate Quality with Quality Gates evaluation
- Automate Testing Load Testing and Performance Testing
- Automate Operations with Self-healing with Ansible
- Self-Healing as a Service
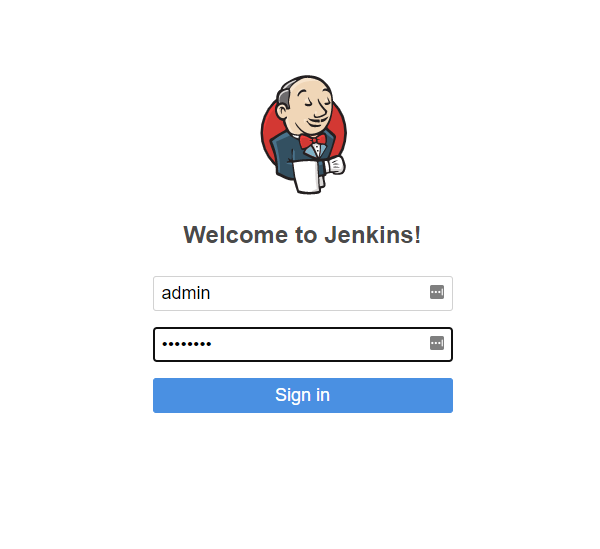
Login to your Jenkins Instance
Access your Jenkins environment via a web browser with credentials from your email
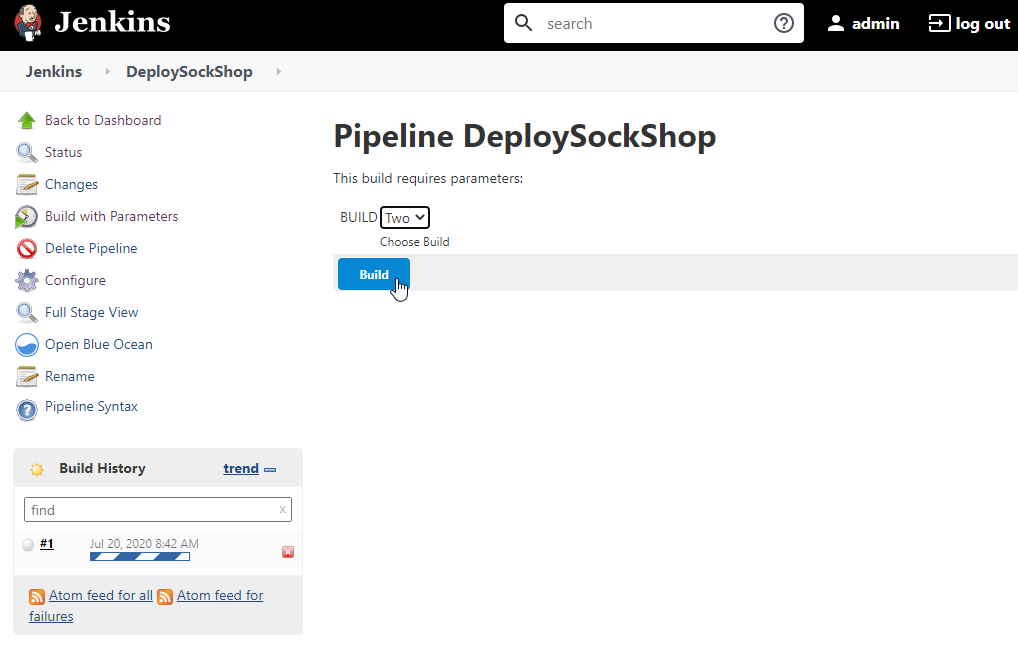
Build a pipeline
Once you logged in, mouseover "DeploySockShop" in the list, click on the down arrow and select "Build Now"
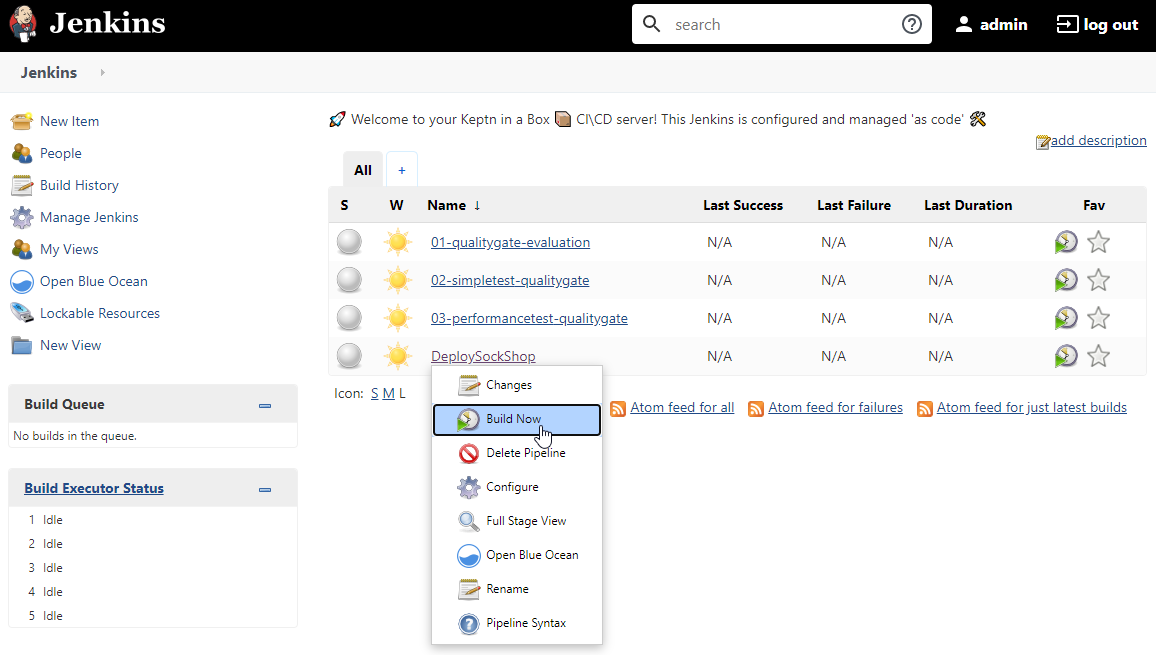
This process will take about 1-2 mins so we will let it run.
Once finished, you can click on "DeploySockshop" again and see the various stages of the pipeline build.
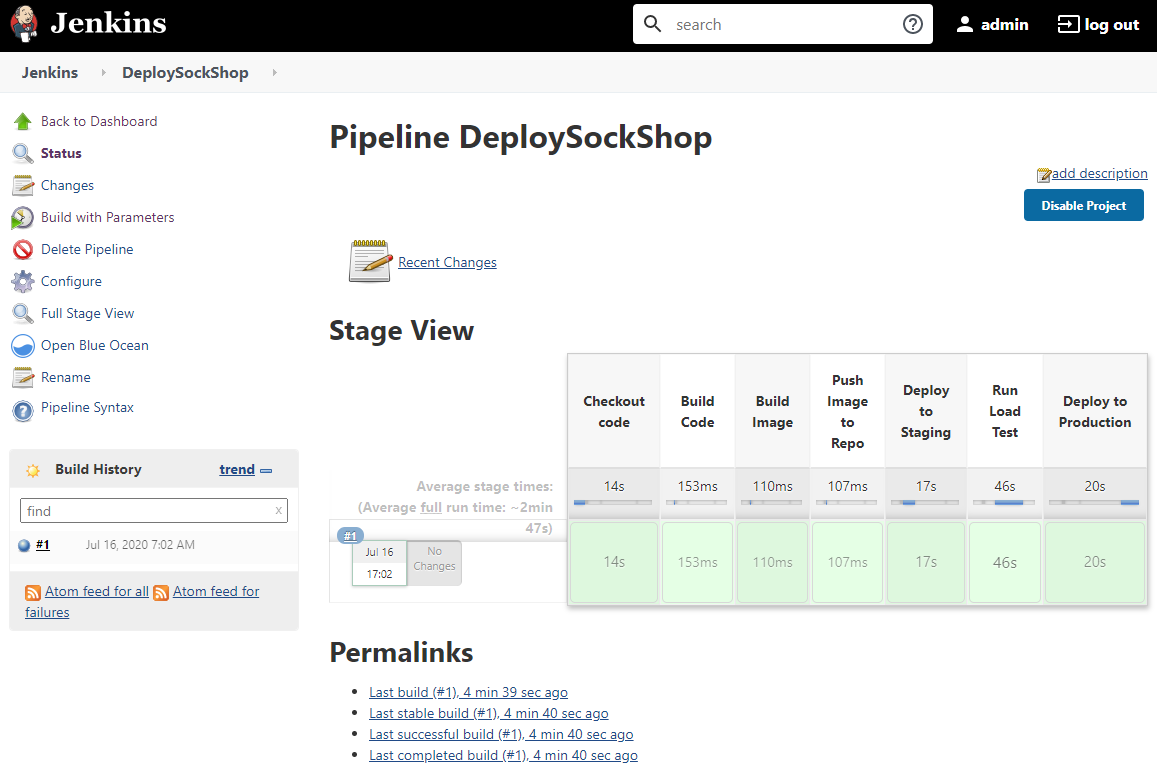
This is just a demonstration of a working pipeline so there's no need to wait for it to complete.
Login to your Kubernetes Instance
Login to the Kubernetes server via a SSH terminal (eg. Putty, Terminal, MobaXterm)
Access your Kubernetes environment with credentials from your email
Once you logged in, you can issue the commands below to install Keptn
Part of the Keptn setup has been automated within the shell script below.
cd dtacmworkshop/keptn
sudo ./installKeptn.sh
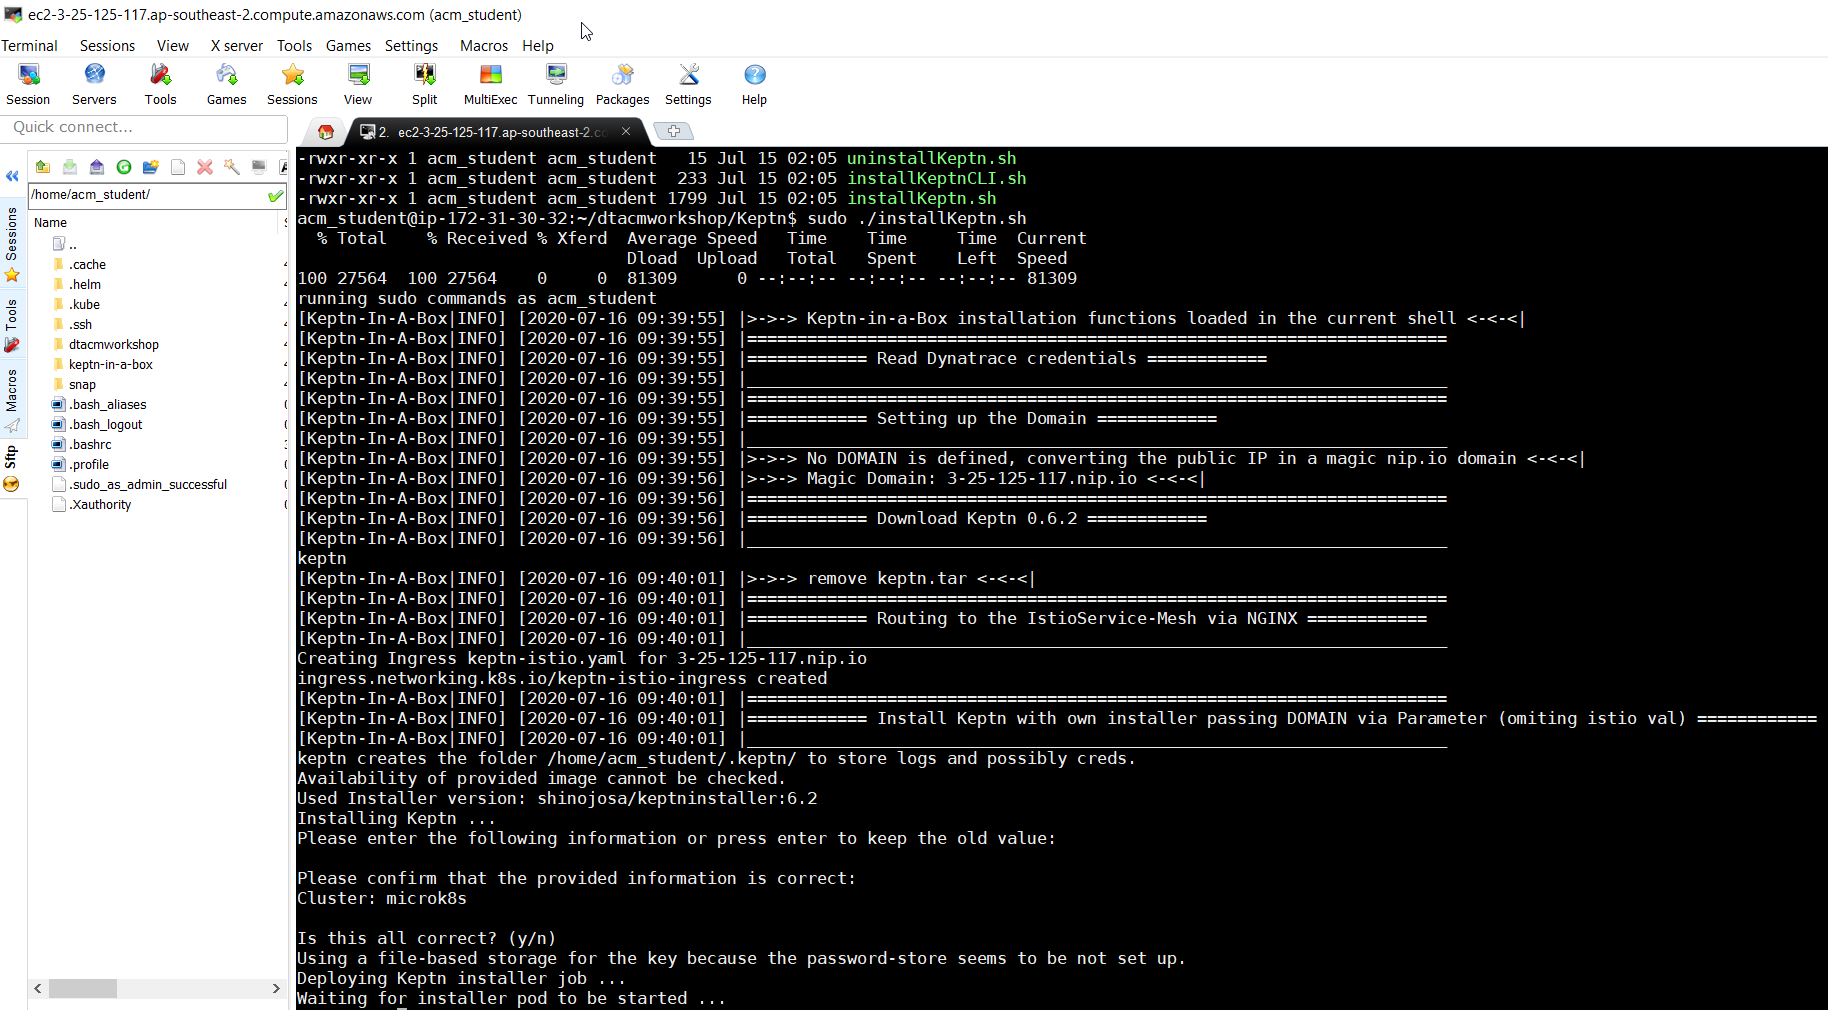
Keptn will install it's necessary components required for its setup. Setup will take a 2-3 minutes.
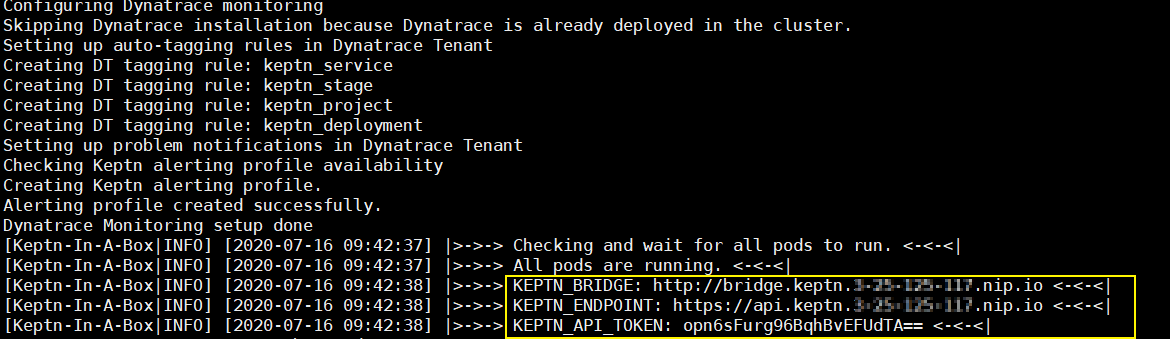
Once completed, take note of the keptn API token which is required for the next step. You can also use the Keptn Bridge and API Endpoint
For example:
KEPTN BRIDGE: http://bridge.keptn.YOUR-IP-ADDRESS.nip.io
KEPTN ENDPOINT: https://api.keptn.YOUR-IP-ADDRESS.nip.io/swagger-ui/
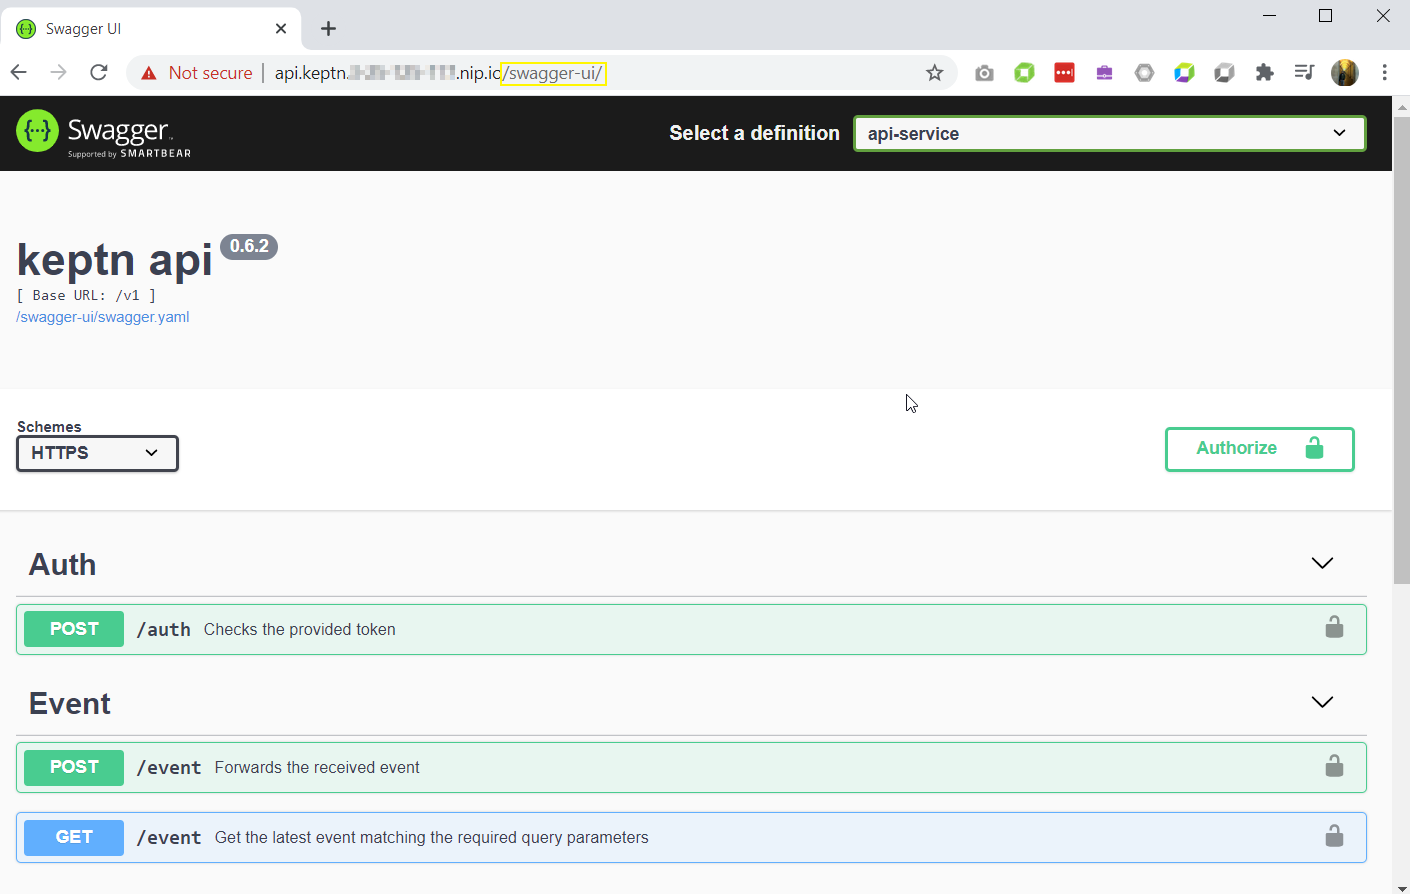 Take note of to append "/swagger-ui/" to the end to view the Keptn API Swagger UI
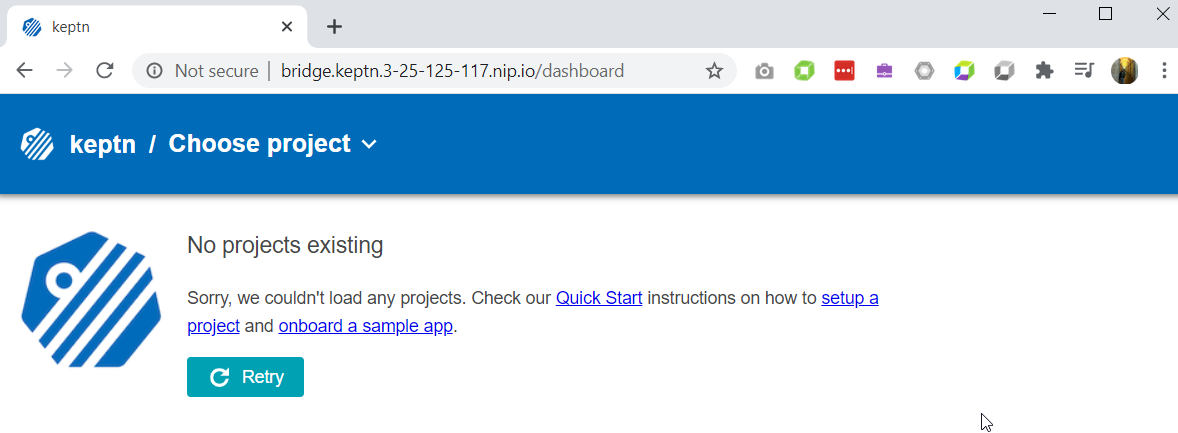 There would be no project running at the moment on Keptn's bridge, but we will be creating at the next step.
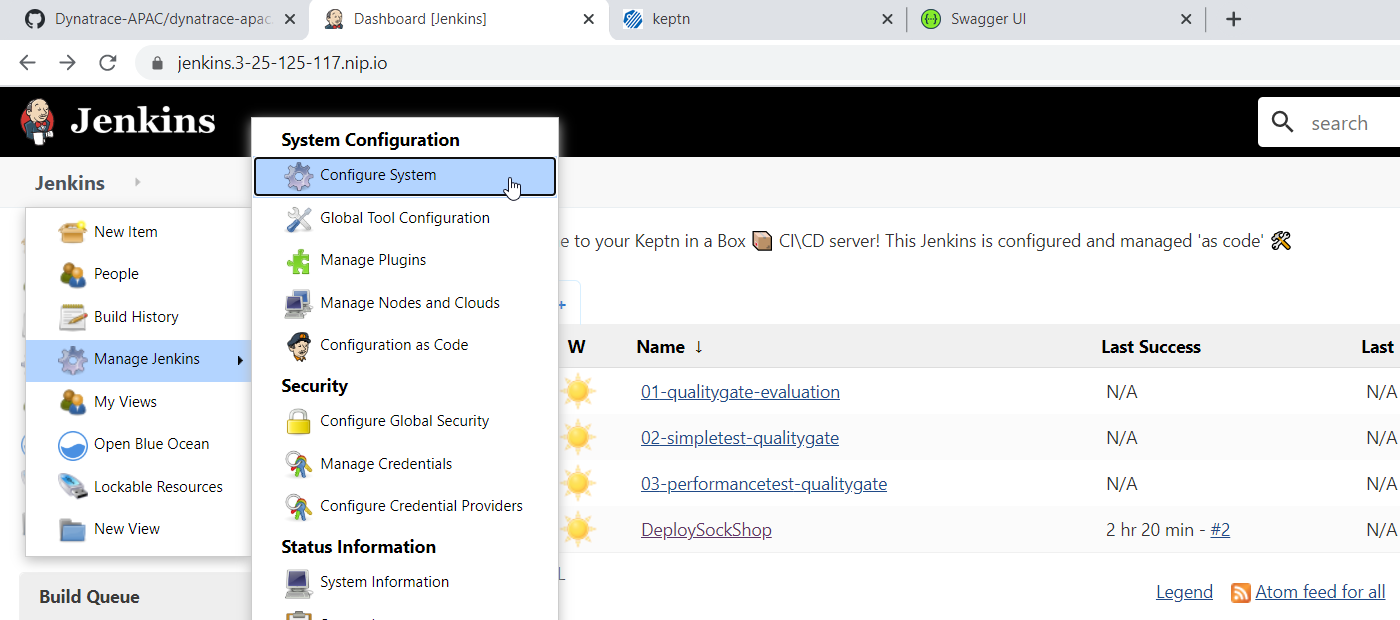
Setting up Keptn Plugin within Jenkins
Back within Jenkins, select Jenkins (from the top left) > Manage Jenkins > Configure System
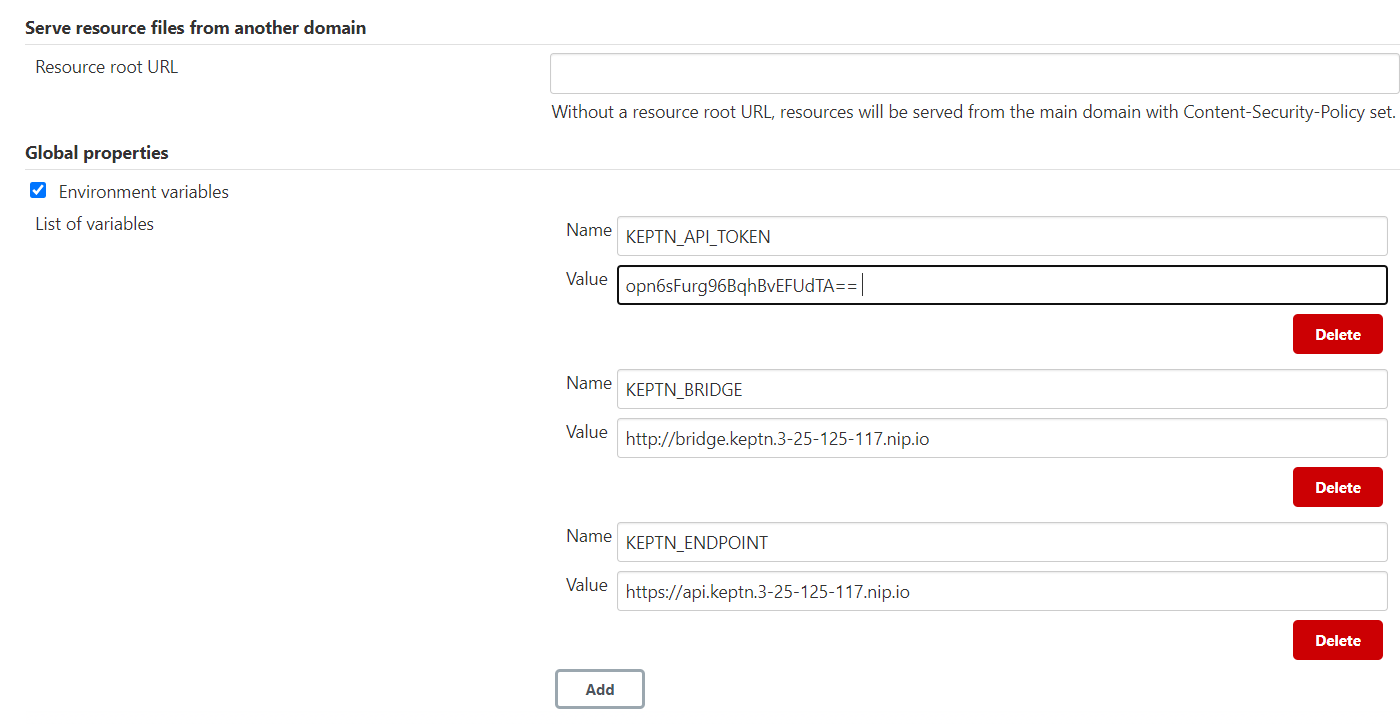
Scroll down and under "Global Properties" enter the KEPTN API Token from the Terminal into the field
Click "Save" to save your setting.
Steps have been pre-configured prior to the labs. To find out more about the plugin, refer to the Keptn Jenkins Shared Library on Github.
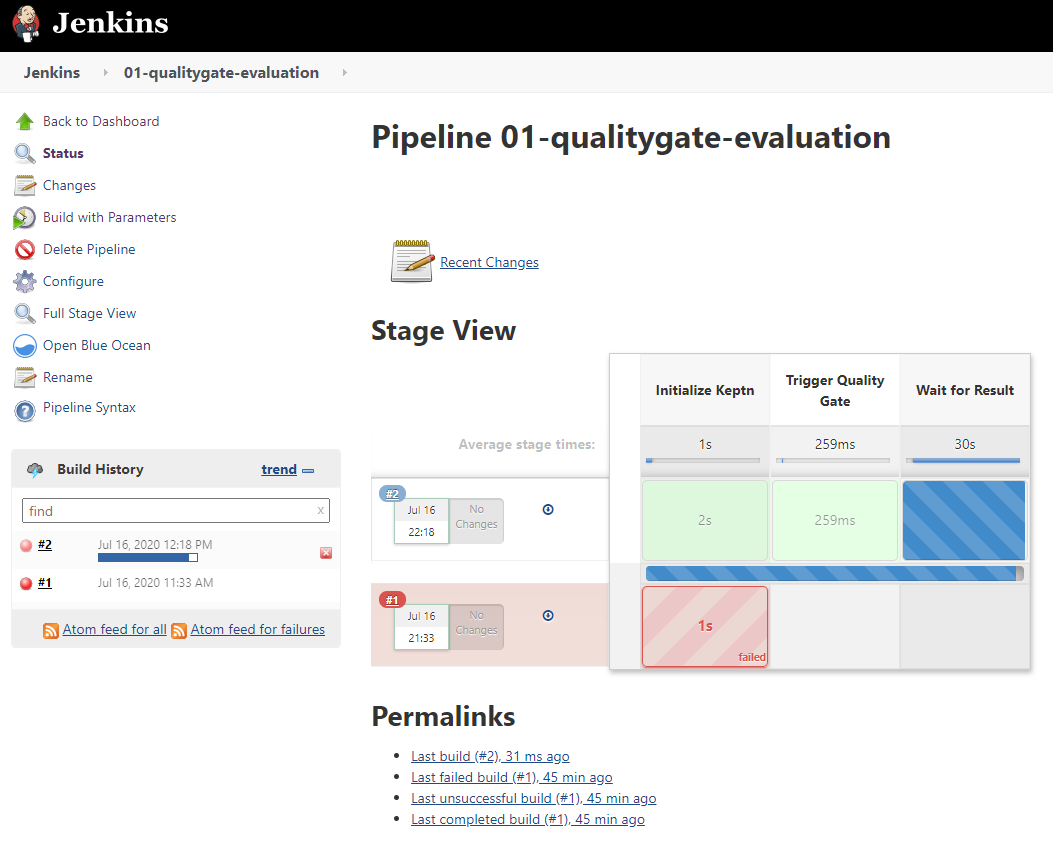
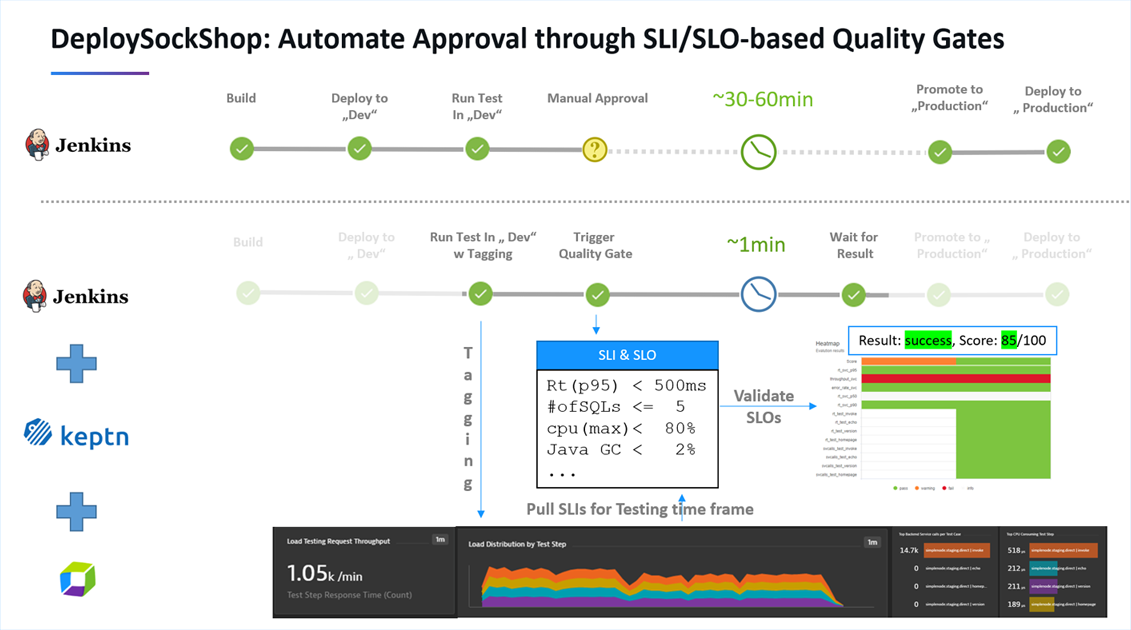
We will be using Jenkins Pipeline to triggers an SLI/SLO-based Quality Gate Evaluation in Keptn. This can also be done through the Keptn CLI or the API.
Within Jenkins, mouseover "01-qualitygate-evaluation" in the list, click on the down arrow and select "Build Now"
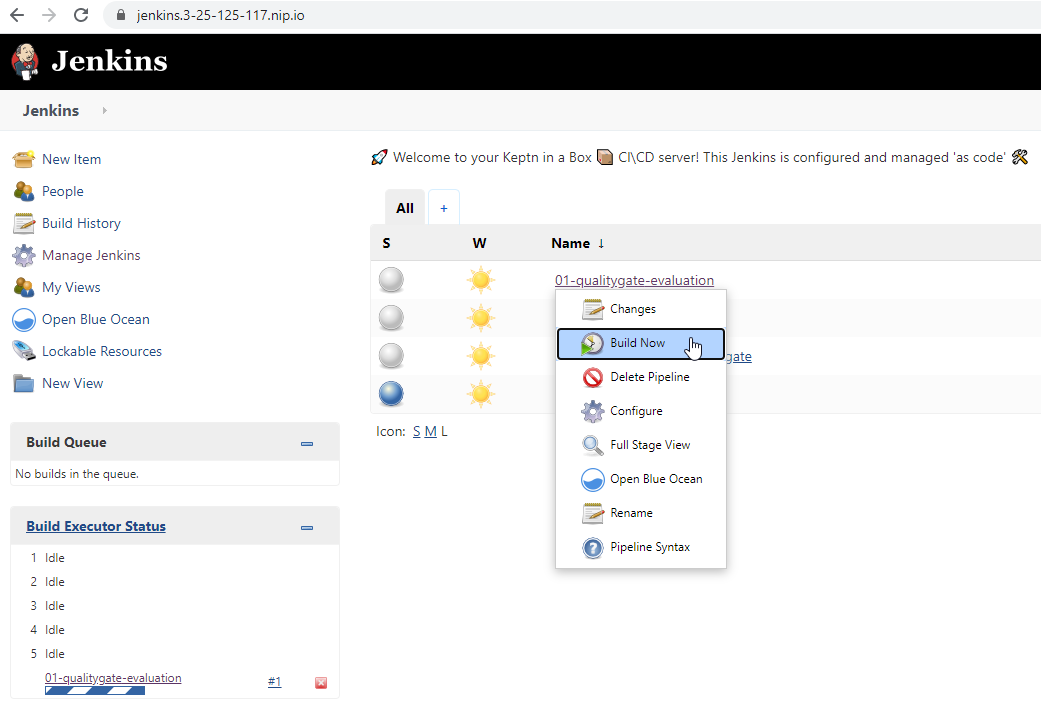
The initial build will fail as Jenkins by default doesn't scan the pipeline for parameters and there are several that have to be specified. Click on "01-qualitygate-evaluation" to drill into the pipeline.
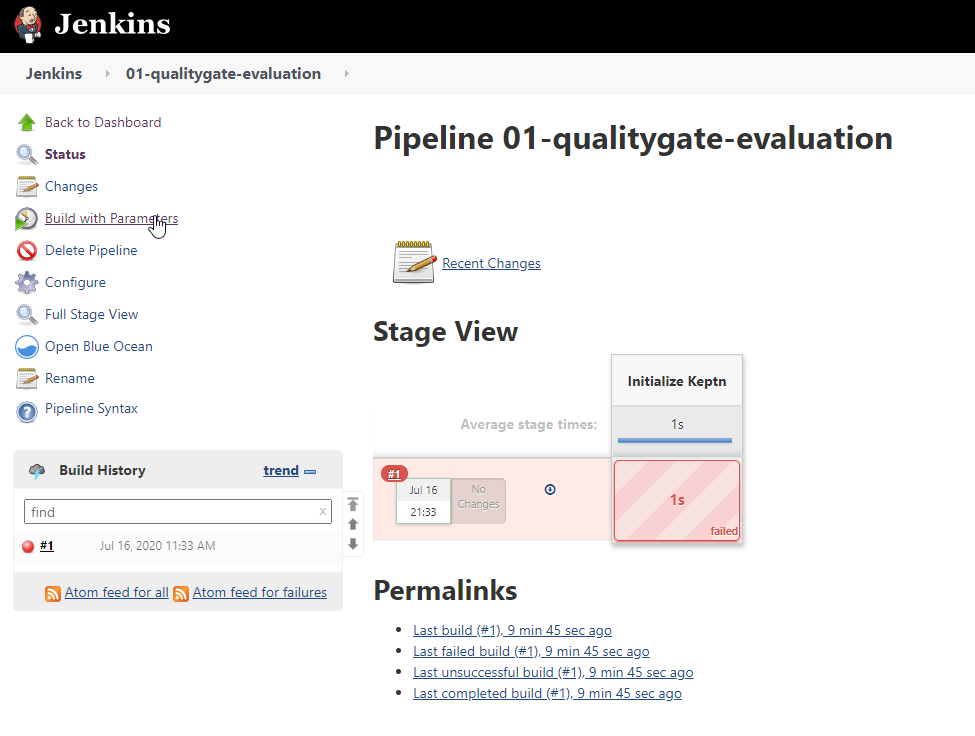
Click on "01-qualitygate-evaluation" and select "Build with Parameters" on the left menu.
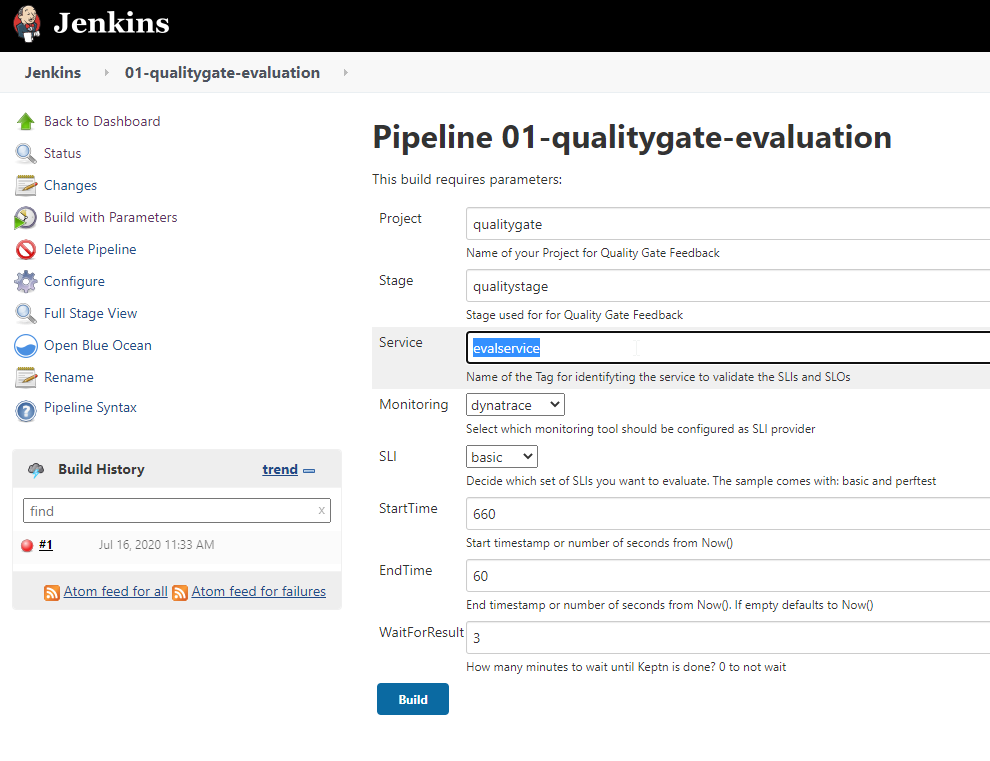
As with the preconfigured form, we will be using the "evalservice" tag within Dynatrace to identify the appropriate service which we will validate the SLI and SLO. The name of the tag can be passed to our Jenkins Pipeline as a parameter. So we will first need to tag a service within Dynatrace.
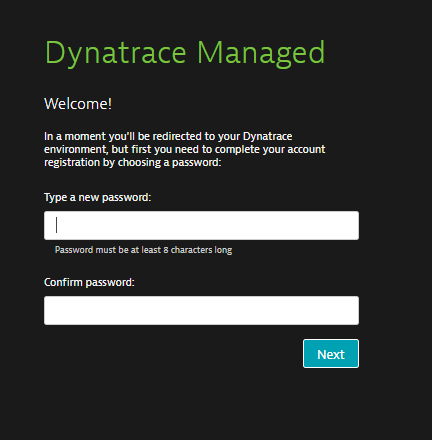
Login to your Dynatrace Environment
Access your Jenkins environment via a web browser with credentials from your email.
When you access your Dynatrace tenant for the first time you'll need to set a password.
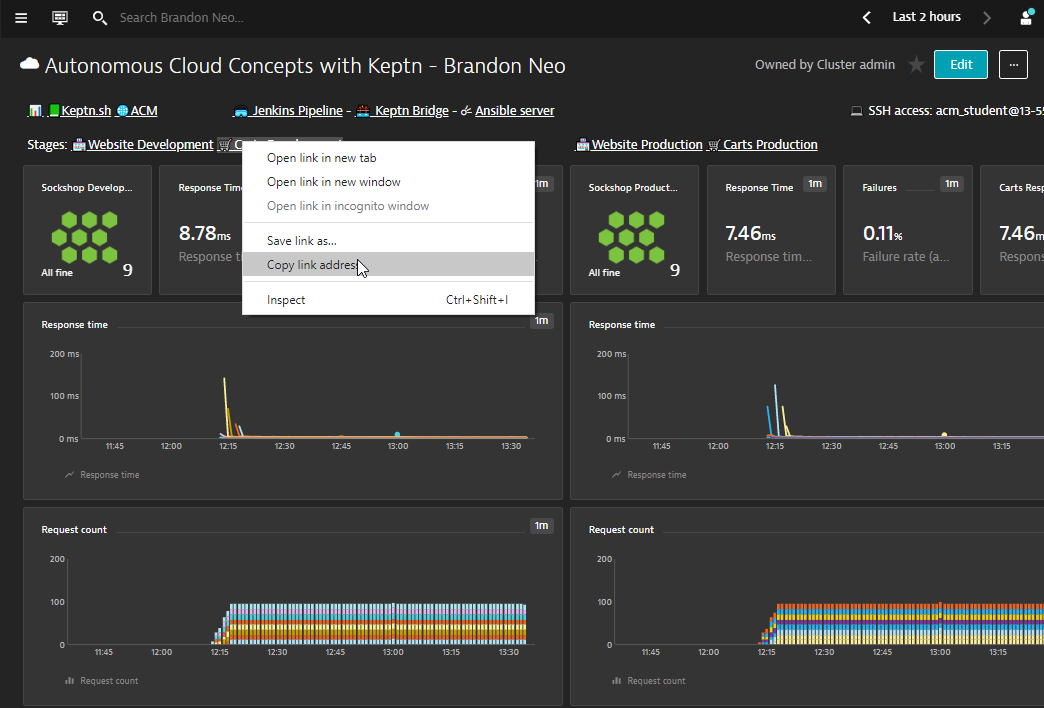
Once you logged into Dynatrace, you will find a preconfigured Dashboard.
Setup Tag within Dynatrace
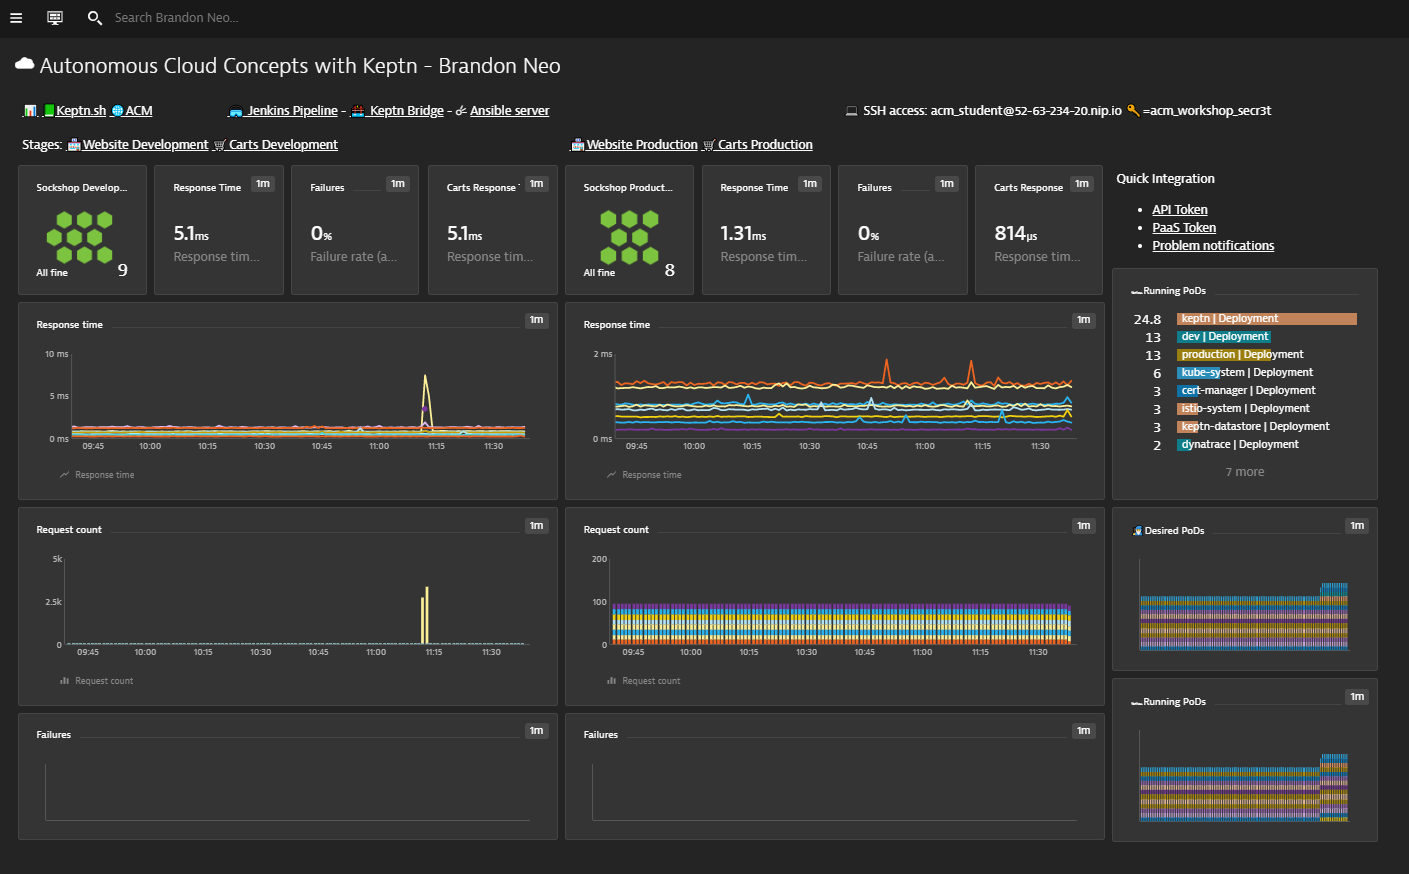
This prebuild dashboard will also contain links providing quick access to the various portals.
Select "Transactions and Services" on the left navigation bar and select "front-end" service.
This can be either for Dev or Prod service.
Drop-down "Properties and tags", Click on "Add-tag" and enter "evalservice" as tag
Build the pipeline in Jenkins
Back in Jenkins, click on "Build" button to run the pipeline
Once the pipeline completes, you can see the changes reflected in Keptn's bridge and Dynatrace.
Within Dynatrace, you will also discover a new custom info event.
The new event will contain details of the quality gate results with details such as JobURL, JobName from Jenkins as well as Keptn source and Keptn's bridge.
The links will also bring you to Jenkin's and Keptn's portals with more detailed information on each side.
To find out more about the setup of this hands-on, the full tutorial could be found here.
Load Testing in Pipeline
This is an extended version of the previous build where the pipeline also has a very simple load-testing capability built-into one of the stages.
Go to "Transactions and Services", filter with "[Kubernetes]stage:dev" tag and tag "testservice" to identify the service.
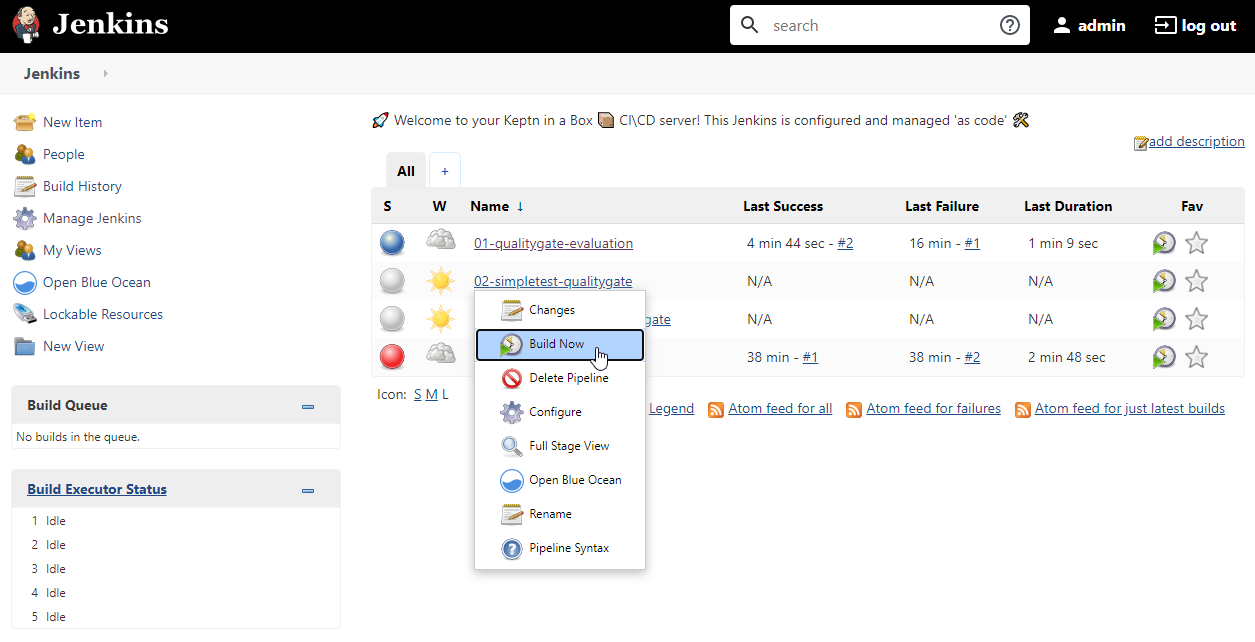
Back In Jenkins, click on "Back to Dashboard" to return to the list of Jenkin's pipelines.
Mouseover "02-simpletest-qualitygate" in the list, click on the down arrow and select "Build Now"
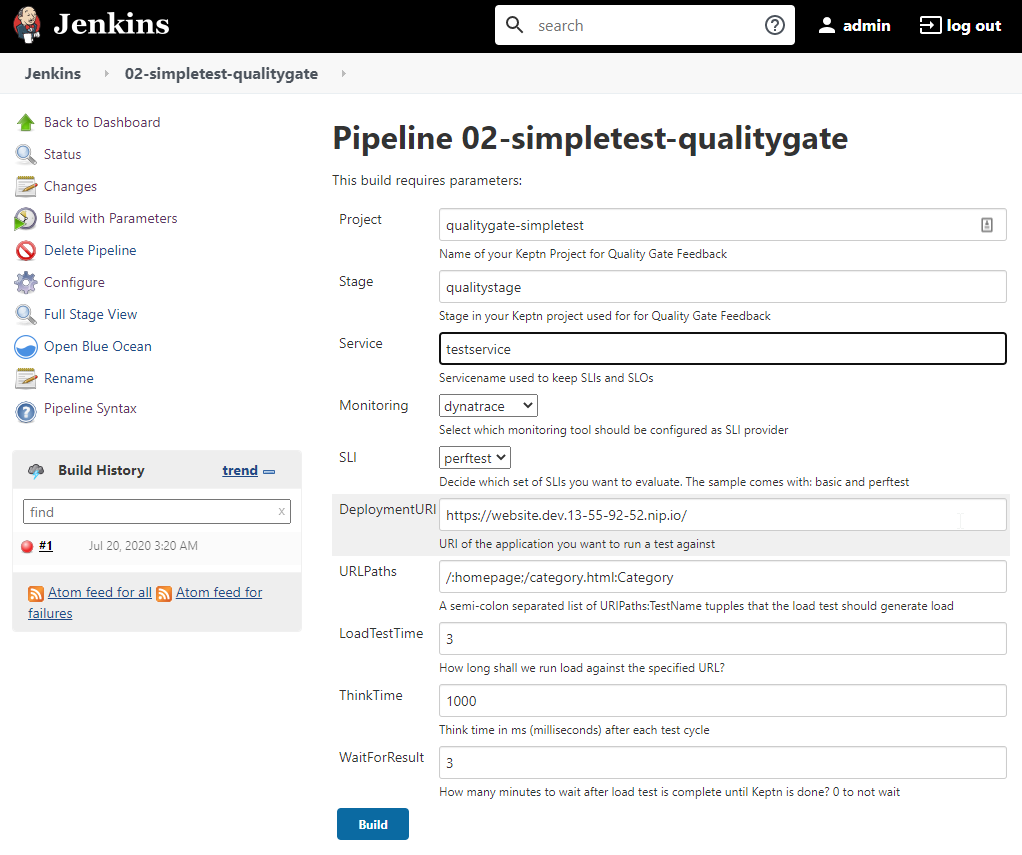
As per the previous lab, the initial build will fail but you can drill into the "Build with parameters" on the 2nd attempt.
Change the form with the following details:
Service: testservice
DeploymentURI: Website Dev URL (as provided in email)
URL Paths: /:homepage;/category.html:Category
Once completed, you can click on "Build" button to start the pipeline.
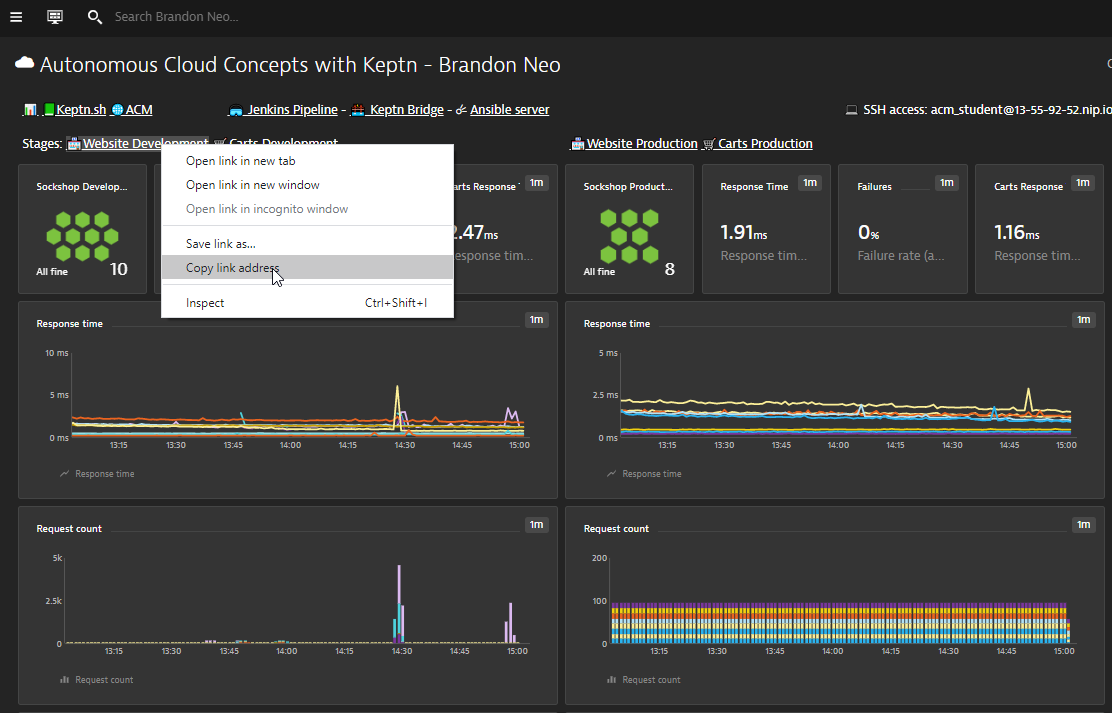
You can also get the URL of your Carts Dev URL from your dashboard.
Simply right-click and copy link address.
Once completed, you can look at Keptn's bridge / Dynatrace's Frontend Service / Jenkins for the changes.
You will find the additional SLIs based on the calculated service metrics.
To find out more about the setup of this hands-on, the full tutorial could be found here.
Performance Testing in Pipeline
This lab extends the previous one where we had Jenkins execute a simple test as part of the Jenkins Pipeline. Keptn was then used for SLI/SLO based quality-gate evaluation. In this tutorial we use Keptn to also take care of the actual test execution using JMeter.
We will also be using calculated service metrics as defined SLIs for the test execution.
The creation of these service metrics was created as part of the lab setup.
These metrics could be found in Settings > Server-side service monitoring > Calculated Service metrics
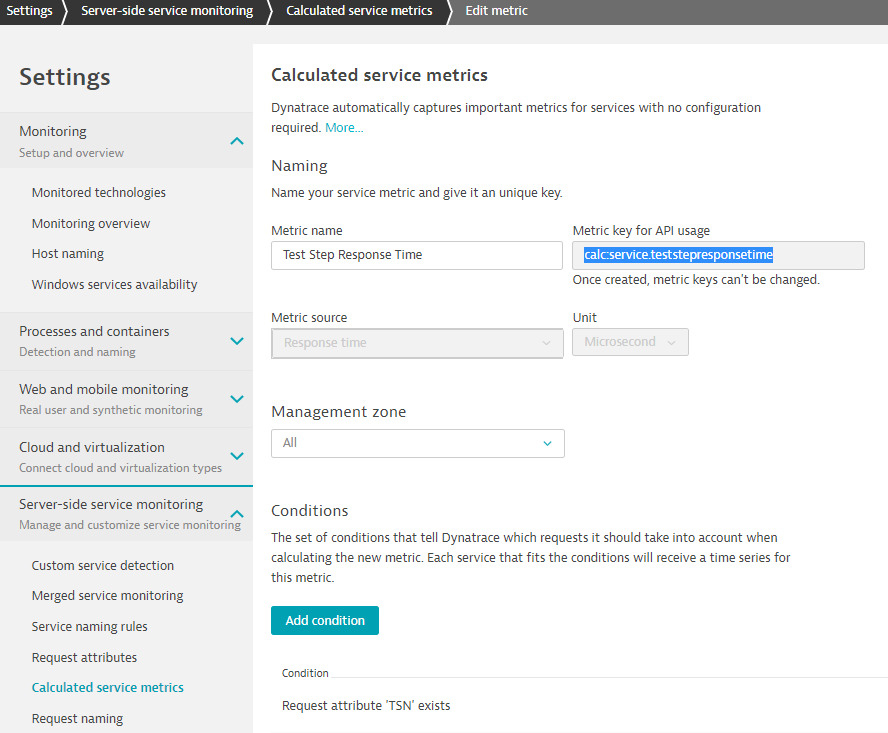
These metrics as well as their dimensions will be used during the execution of the SLIs.
As we already added the "testservice" tagged, we can simply run the 3rd pipeline within Jenkins.
Back in Jenkins, click on "03-performancetest-qualitygate".
Change the form with the following details:
Service: testservice
DeploymentURI: Website Dev URL (as provided in email)
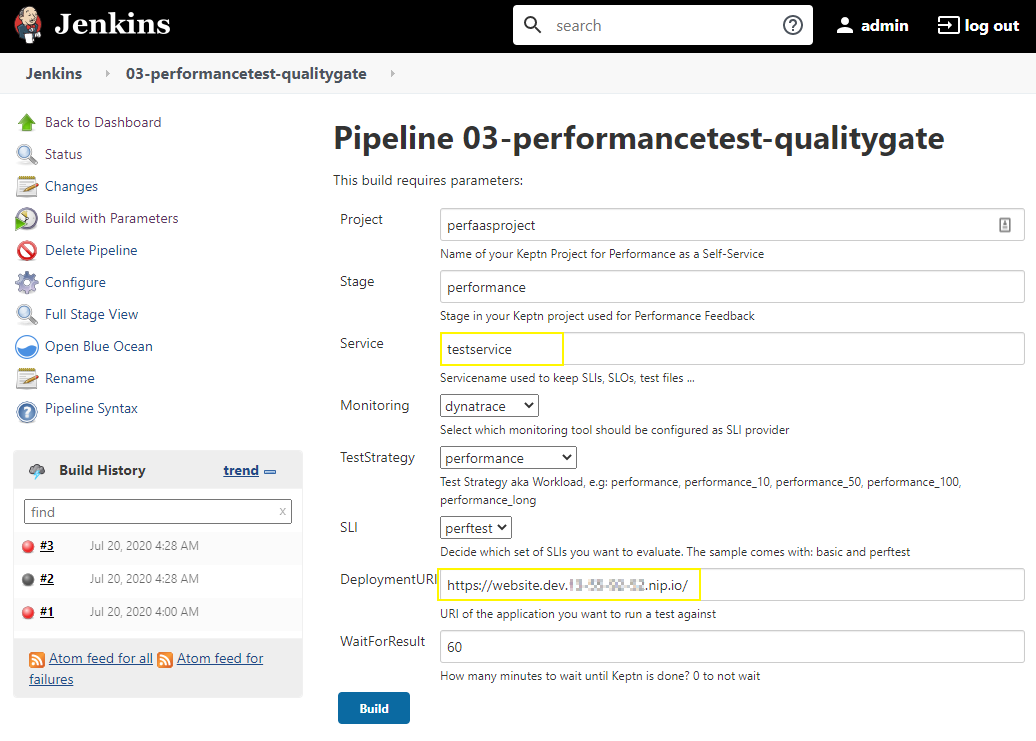
Once completed, you can click on "Build" button to start the pipeline.
You can also get the URL of your Carts Dev URL from your dashboard.
Simply right-click and copy link address.
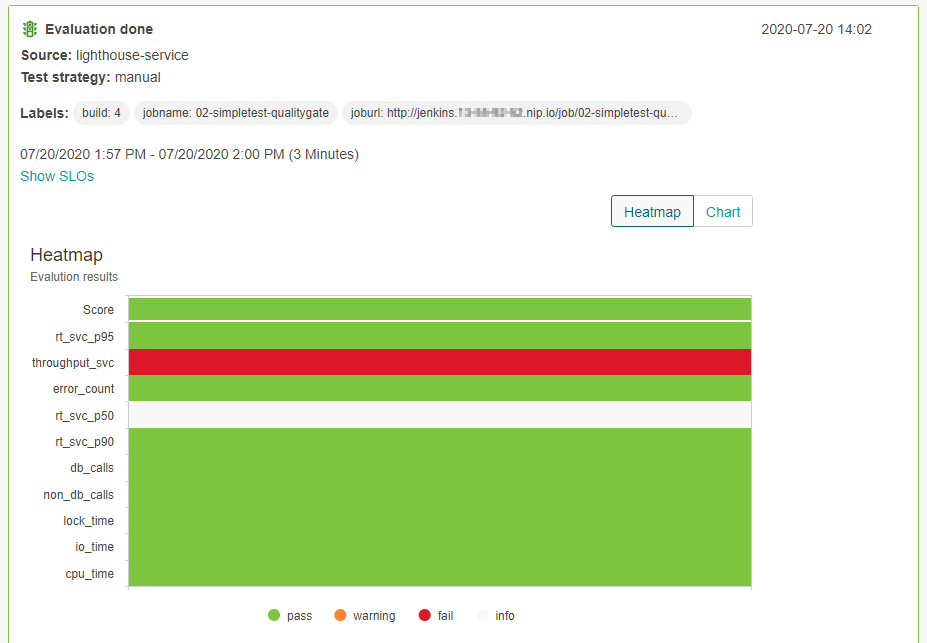
Once completed, you can look at Keptn's bridge / Dynatrace's Frontend Service / Jenkins for the changes.
Within Dynatrace, you can see the automated performance tests that generated a pass result for the quality gate.
You can also drill in context into Keptn's bridge as well as Jenkins.
We will now modify the SampleApp Sockshop by automating it with Keptn's SLI/SLO-based Quality Gates.
Within Jenkins, mouseover "DeploySockShop" in the list, click on the down arrow and select "Configure"
Open another browser tab, go to Dynatrace APAC's Autonomous Cloud's Git Repo.
Copy the amended SockShop Jenkinsfile raw file and replace it within the Pipeline section in Jenkins.
Click on "Save" and at the "Build with Parameters" page, select "Build Two" and start the build.
Dynatrace integrates with many runbook automation tools such as Ansible. We'll be using Ansible to showcase self-healing problems and automate operations.
Generate Load for Carts Service
Within the SSH terminal, run the following commands to trigger load for the carts service.
cd ~acm_student/dtacmworkshop/utils/
sudo ./cartsLoadTest.sh
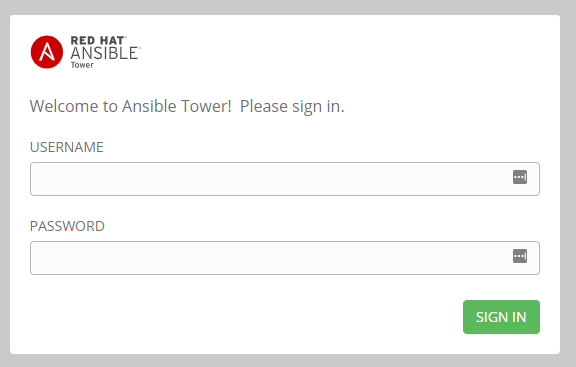
Login to Ansible Tower
Access your Ansible environment via a web browser with credentials from your email.
Configure Dynatrace Problem Notification
Within Ansible, click on "Templates" on the left navigation and copy the URL for Remediation Job template.
In the Dynatrace UI, navigate to **Settings > Integration > Problem Notification > Setup Notification > Ansible Tower **
Enter the Ansible Tower job template URL you copied
Enter the credentials to access Ansible (as provided in email)
Click the Sent test notification button to validate your configuration
On success, a green confirmation message will be displayed
Save your configuration
Adjusting Anomaly Detection
Both problem and anomaly detection in Dynatrace leverage our DAVIS AI technology. This means that DAVIS learns how each and every microservice behaves and baselines them. Therefore, in a demo scenario like we have right now, we have to override the AI engine with user-defined values to allow the creation of problems due to an artificial increase of a failure rate. (Please note: if we would have the application running and simulate end-user traffic for a couple of hours/days there would be no need for this step.)
In your Dynatrace tenant, navigate to "Transaction & services" and filter by tag "[Kubernetes]stage:prod" and select ItemsController Service
Within the ItemsController Service page, click on on the three dots ( ... ) next to the service name. Click on Edit
On the next screen, edit the anomaly detection settings as per below
- Disable Global anomaly detection
- Detect increases in failure rate using fixed thresholds
- Alert if 0 % custom failure rate threshold is exceed during any 5-minute period.
- Set Sensitivity to High and change less than the value to 1 request/min.
Launch remediation playbook
Navigate back to the Ansible Tower UI. From the side menu, navigate to Resources -> Templates.
Click on the rocket icon to launch the start-campaign playbook.
Hit Next on the prompt popup window and then Launch.
As the playbook runs, validate that status is successful.
Observe remediation
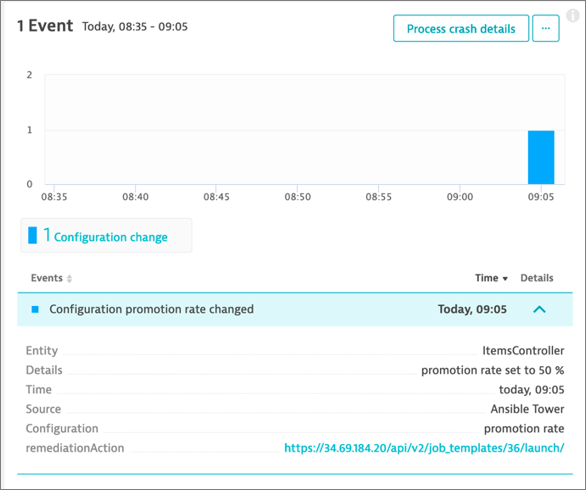
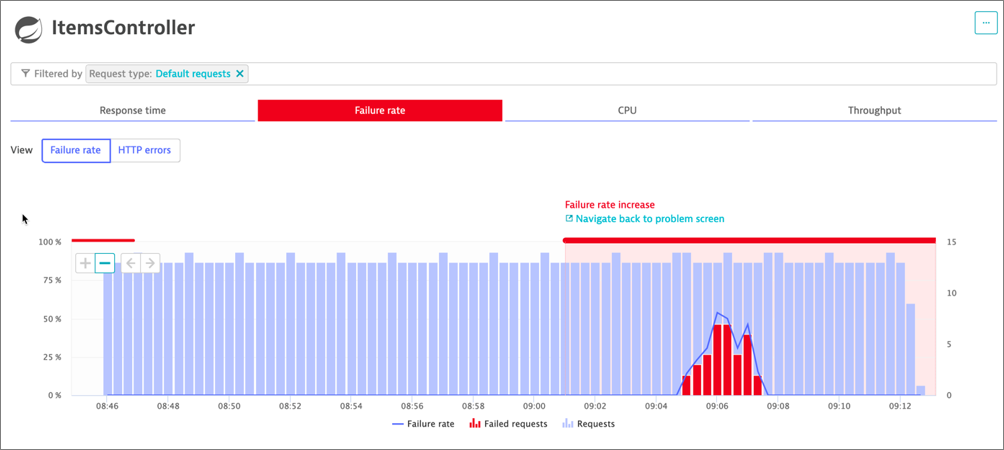
Back in ItemsController, look at the service events. The playbook have notified Dynatrace when the promotional rate was changed to 50%.
You should see the Failure Rate increasing, eventually leading to Dynatrace detecting a Problem You might need to refresh your browser a few times
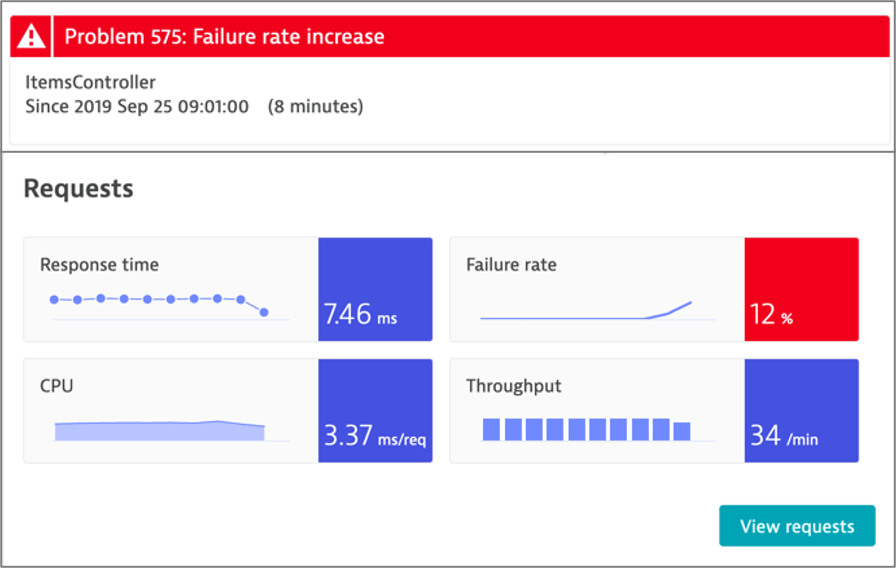
Observe the new problem appearing. The comments section will show the remediation actions taken by Ansible Tower
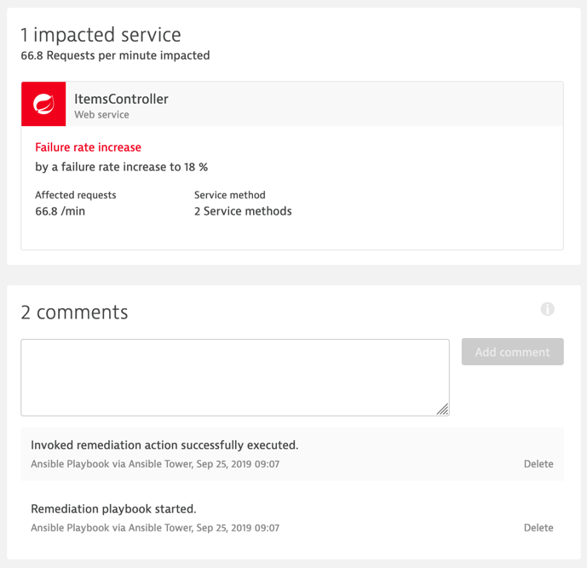
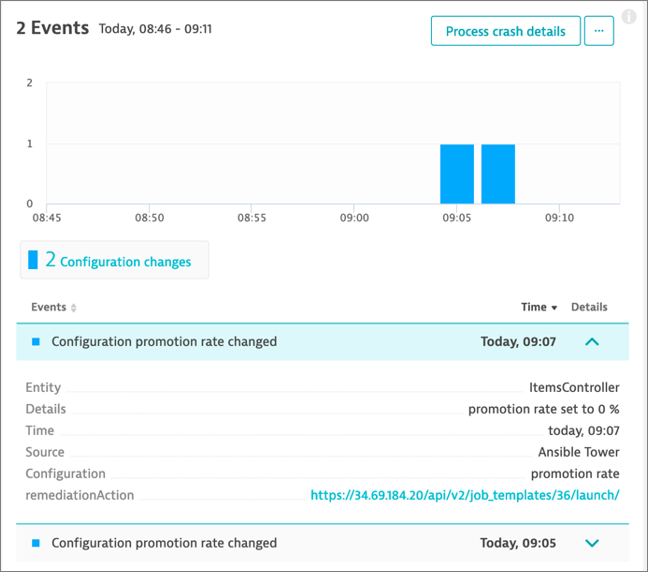
Drill-down in the Problem. You will see a new configuration change event reported by Ansible Tower The promotional rate has been set back to 0% to remediate to the transaction failures
Jobs executed in Ansible Tower
- start-campaign (set rate to 50%)
- remediation
- push comment to Dynatrace Problem
- retrieve problem details
- launch remediation action related to problem context
- update Dynatrace Problem stop-campaign (set rate to 0%)

** Problem Resolution - Problem was resolved automatically
We hope you enjoyed this lab and found it useful. We would love your feedback!