This Repo contains the labs we are going to work though as part of the BizOps – Bridging the Gap to the Business Hands On Workshop.
For the purposes of the Hands-On, we will automate and make the steps seamless for the participants
Prerequisites
- Dynatrace SaaS/Managed Account. Get your free SaaS trial here.
Lab Setup
The following steps are used for this lab:
- AWS account (used to create an EC2 instance from a public AMI)
- Signup to a free trial here
- Sample Application
- Sample App is based on easyTravel Docker
- Follow the Prerequisite Actions to create the application that will be used throughout this workshop.
What You'll Learn
- Understand Real User Monitoring setup with easyTravel App
- Learn Digital Business Analytics
- Learn Dynatrace Capabilities such as
- User Action Naming
- Key User Actions
- User Session Properties
- User Session Query Language (USQL)
- Dynatrace Dashboards
- BizOps Configurator
- Exporting into Excel and Power BI
In this lab, we will be doing basic setup within Dynatrace.
Some of these tuning tips has already been done for you.
- Enable JavaScript framework support
- Configure User Tagging
- Configure User Action Naming
- Add Key User Actions
- Usability analytics
Marking Key User Actions
- Access the easyTravel Website application
- Under Top 3 user actions click View full details
- Scroll down to Top 100 user actions and filter a user action e.g. orange-booking-finish.jsf
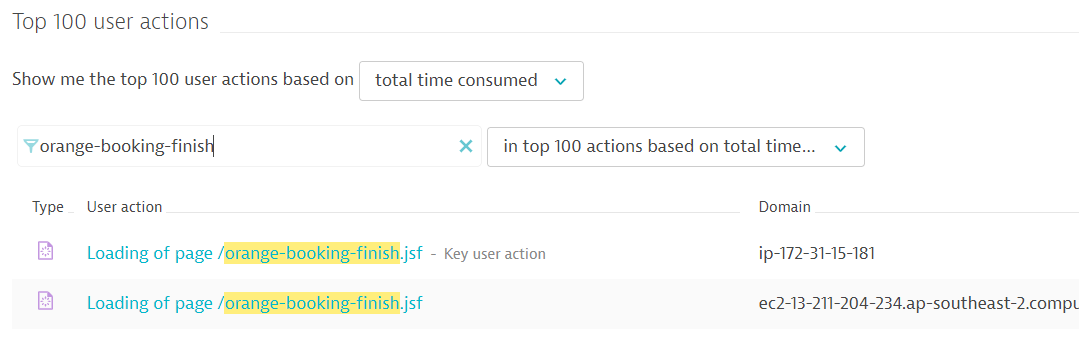
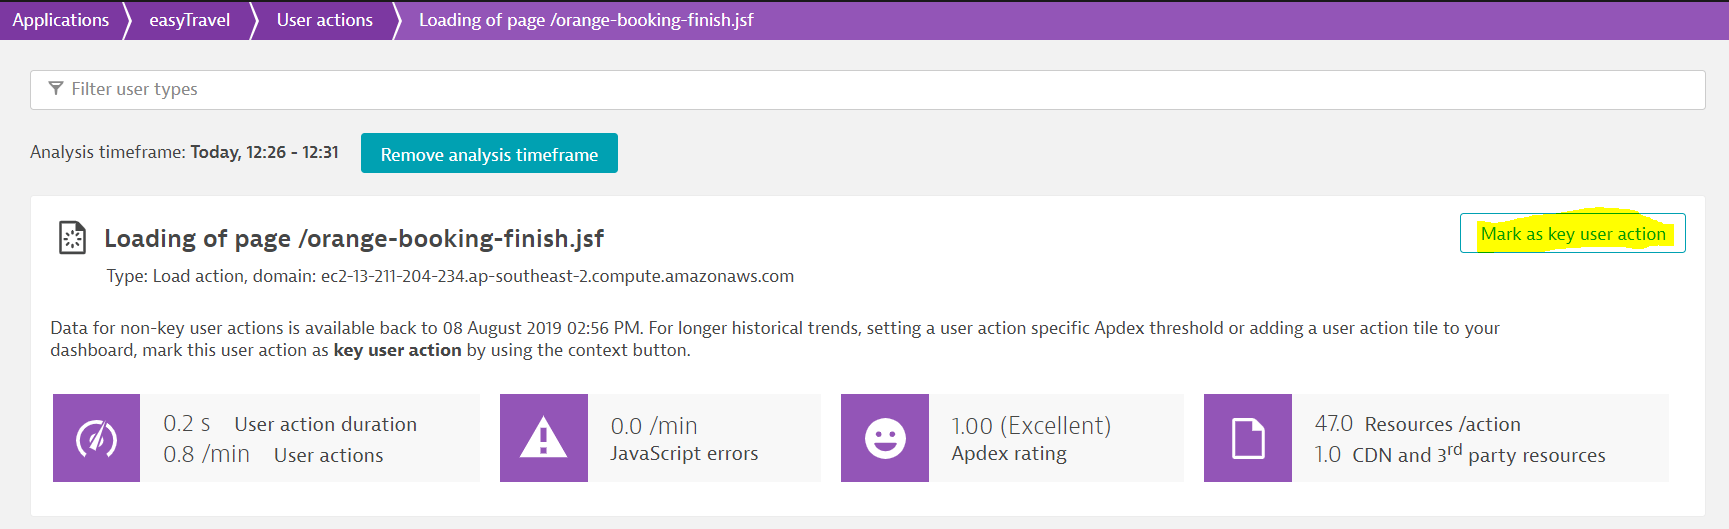
- Click on the user action e.g Loading of page /orange-booking-finish.jsf then click on Mark as key user action
Repeat the above to add the following as key user actions:
- loading of page /
- loading of page /orange.jsf
- loading of page /orange-booking-finish.jsf
- loading of page /orange-booking-review.jsf
- loading of page /orange-booking-payment.jsf
- click on "login" on page /orange.jsf
- click on "login" on page /
- click on "search" on page /orange.jsf
- click on "search" on page /
- loading of page /special-offers.jsp
In this lab, we will create the following dashboard:
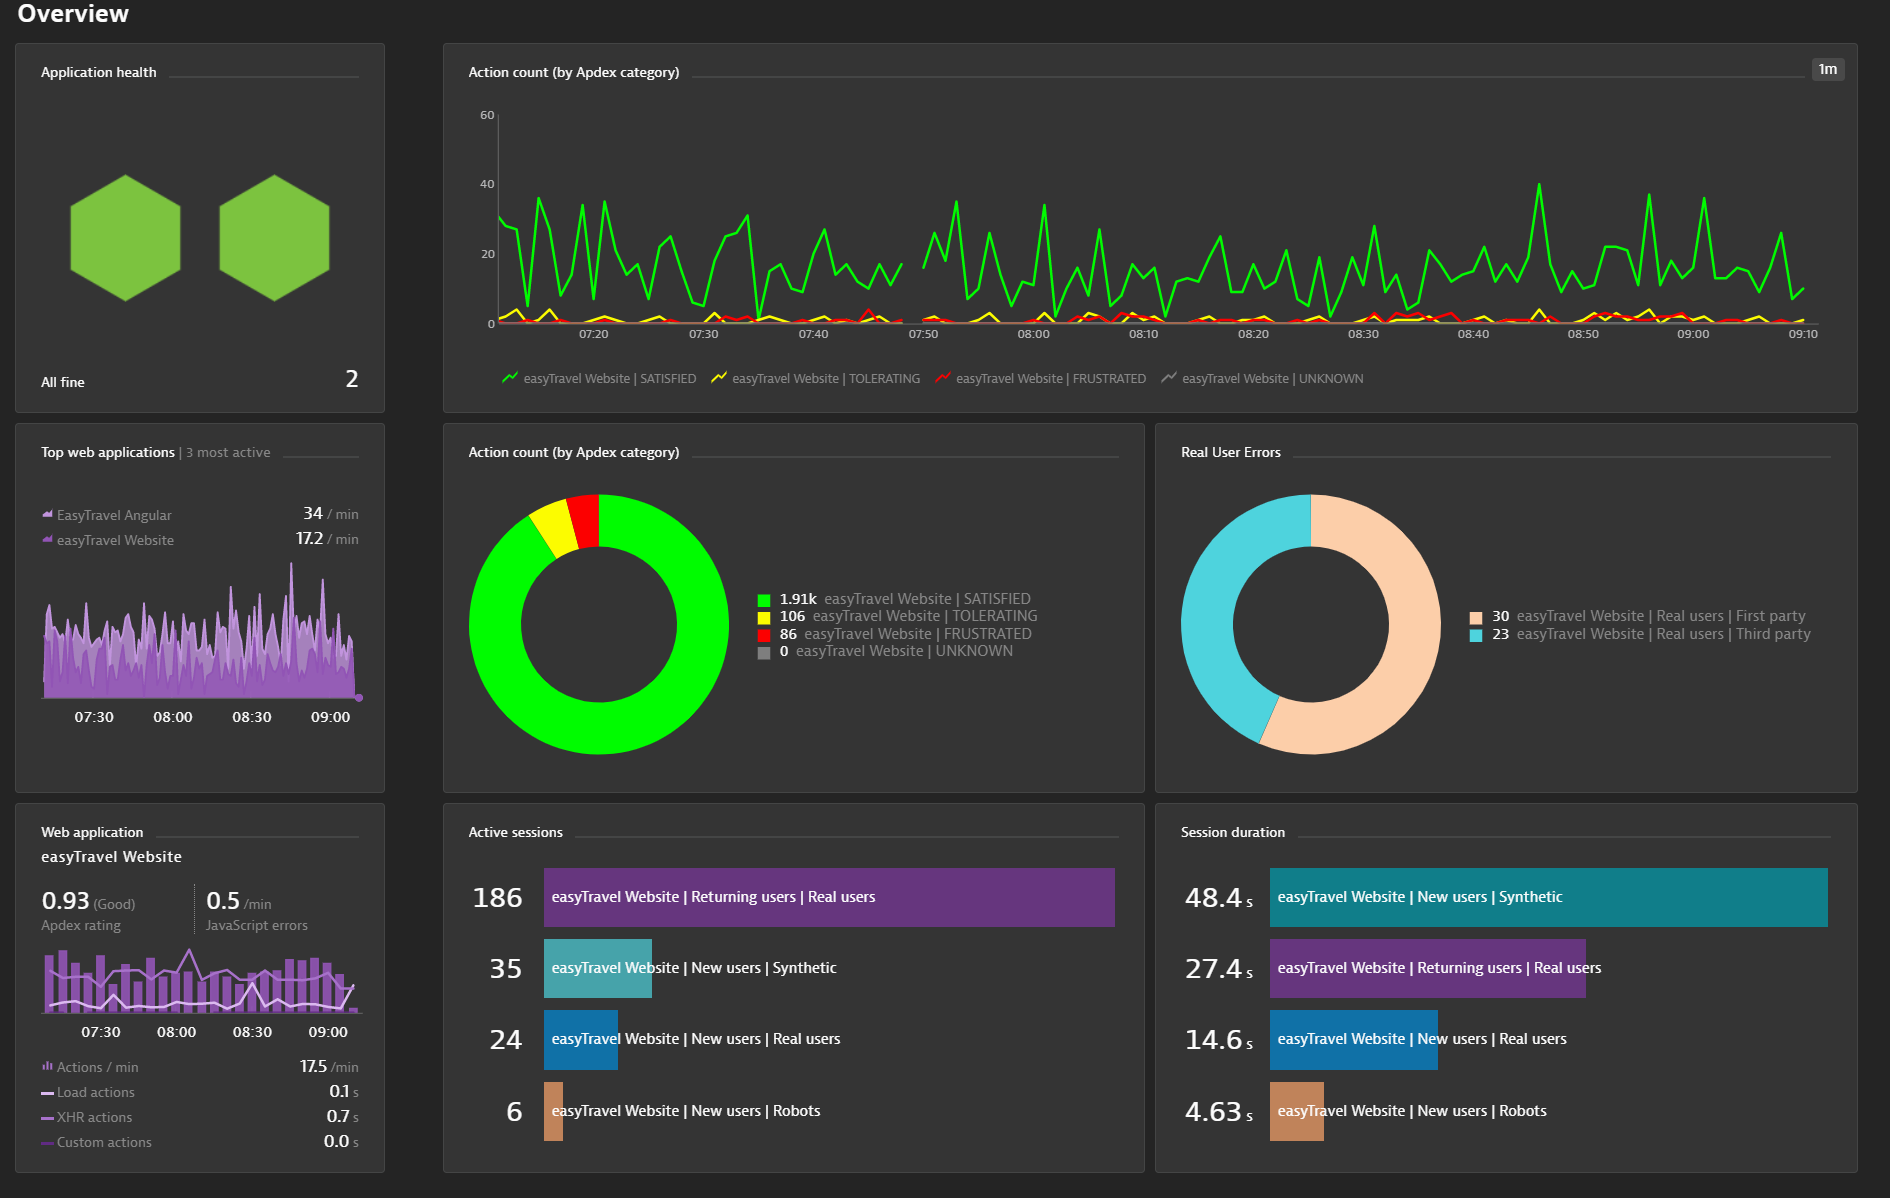
Dashboard Components
The above dashboard has the following components:
Out of the Box Tiles:
- Application Health
- Top web applications
- Web Application > easyTravel Website
Custom Chart Tiles:
- Action count (by Apdex category)
- Category: Applications
- Metric: Action count (by Apdex category) (Sum)
- View Results as: Timeseries
- Dimensions to split by:
- Web Application: true, Filtered by easyTravel Website
- Apdex category: true
- Action count (by Apdex category)
- Category: Applications
- Metric: Action count (by Apdex category) (Sum)
- View Results as: Pie
- Dimensions to split by:
- Web Application: true, Filtered by easyTravel Website
- Apdex category: true
- Real User Errors
- Category: Applications
- Metric: Count of errors (by user type, error type and error origin) (Sum)
- View Results as: Pie
- Dimensions to split by:
- Web Application: true, Filtered by easyTravel Website
- User type: true, Filtered by: Real Users
- Error origin: true
- Active Sessions
- Category: Applications
- Metric: Active Sessions
- View Results as: Top List
- Dimensions to split by:
- Web Application: true, Filtered by easyTravel Website
- Users: true
- User type: true
- Session Duration
- Category: Applications
- Metric: Session Duration
- View Results as: Top List
- Dimensions to split by:
- Web Application: true, Filtered by easyTravel Website
- Users: true
- User type: true
In this lab, we will create conversion goals for the easyTravel application
Conversion Goal
Access the easyTravel Website application monitoring settings Applications > easyTravel Website > (...) > Edit
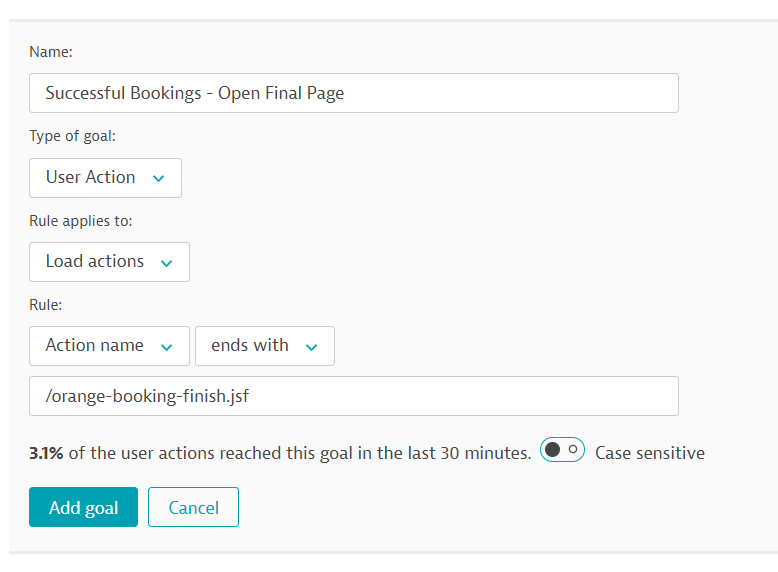
Select Conversion Goals and click Add goal and enter the following:
- Name: Successful Bookings
- Type of goal: User Action
- Rule applies to: Load actions
- Rule: Action Name > contains > loading of page /orange-booking-finish.jsf
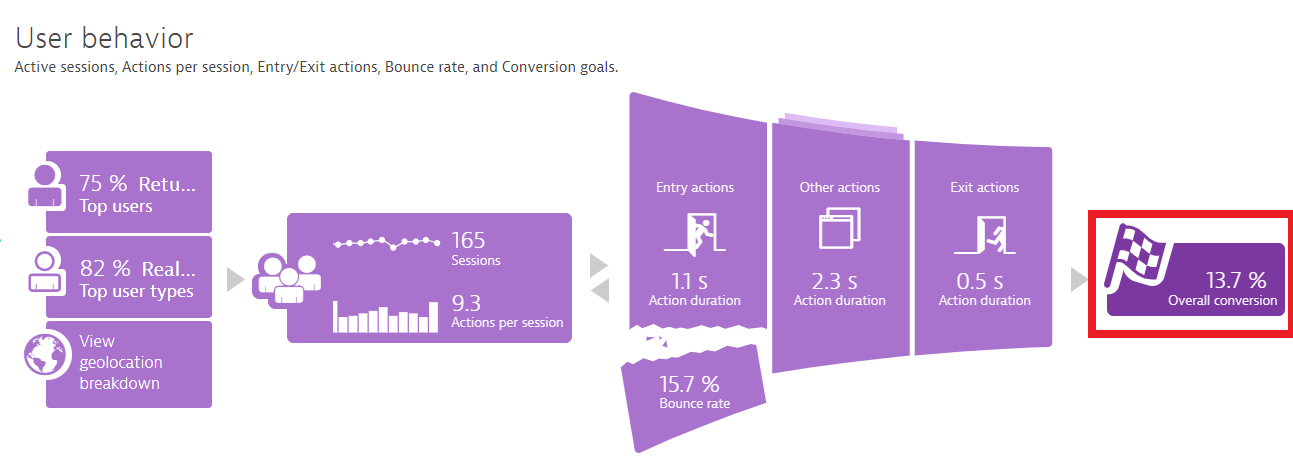
Check results aginst the application: easyTravel > User behavior
In this lab, we will create a session properties to expose business data to Dynatrace
Membership Status
1) Access the easyTravel Website application monitoring settings
Applications > easyTravel Website > (...) Edit
2) Select Session and User action properties, and click Custom defined property and enter the following:
- Expression Type: CSS Selector
- Data Type: String
- Display Name: Membership Status
- Key: membershipstatus
- CSS Selector:
#loginForm\:j_idt43 - Store as user action property: false
- Store as session property: true
- Apply cleanup rule: true
- Cleanup Rule Regex:
(.*?) status!
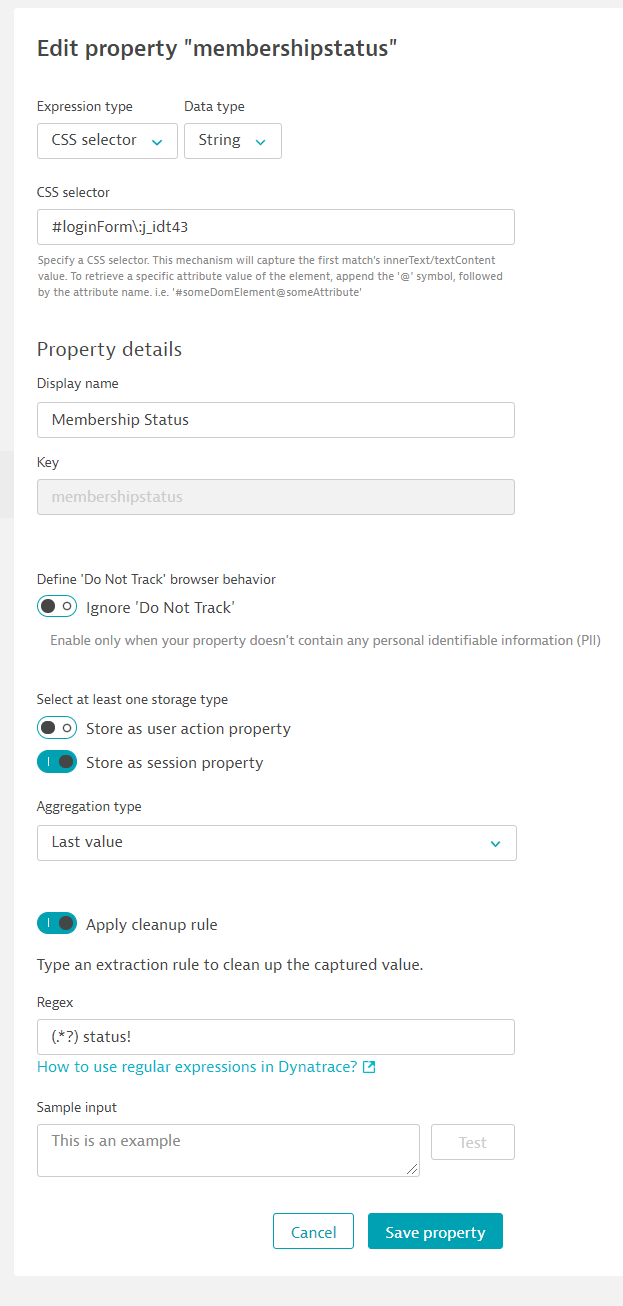
3) Click Save Property
It may take 5-10 mins to see results in Dynatrace because session properties are only available when the user session is completed.
You can view the user sessions that have the membershipstatus set by running the following USQL:
SELECT * FROM usersession WHERE stringProperties.membershipstatus IS NOT NULL ORDER BY startTime DESC
In this lab, we will create a session properties to expose business data Booking Total and Destination to Dynatrace
Booking Total
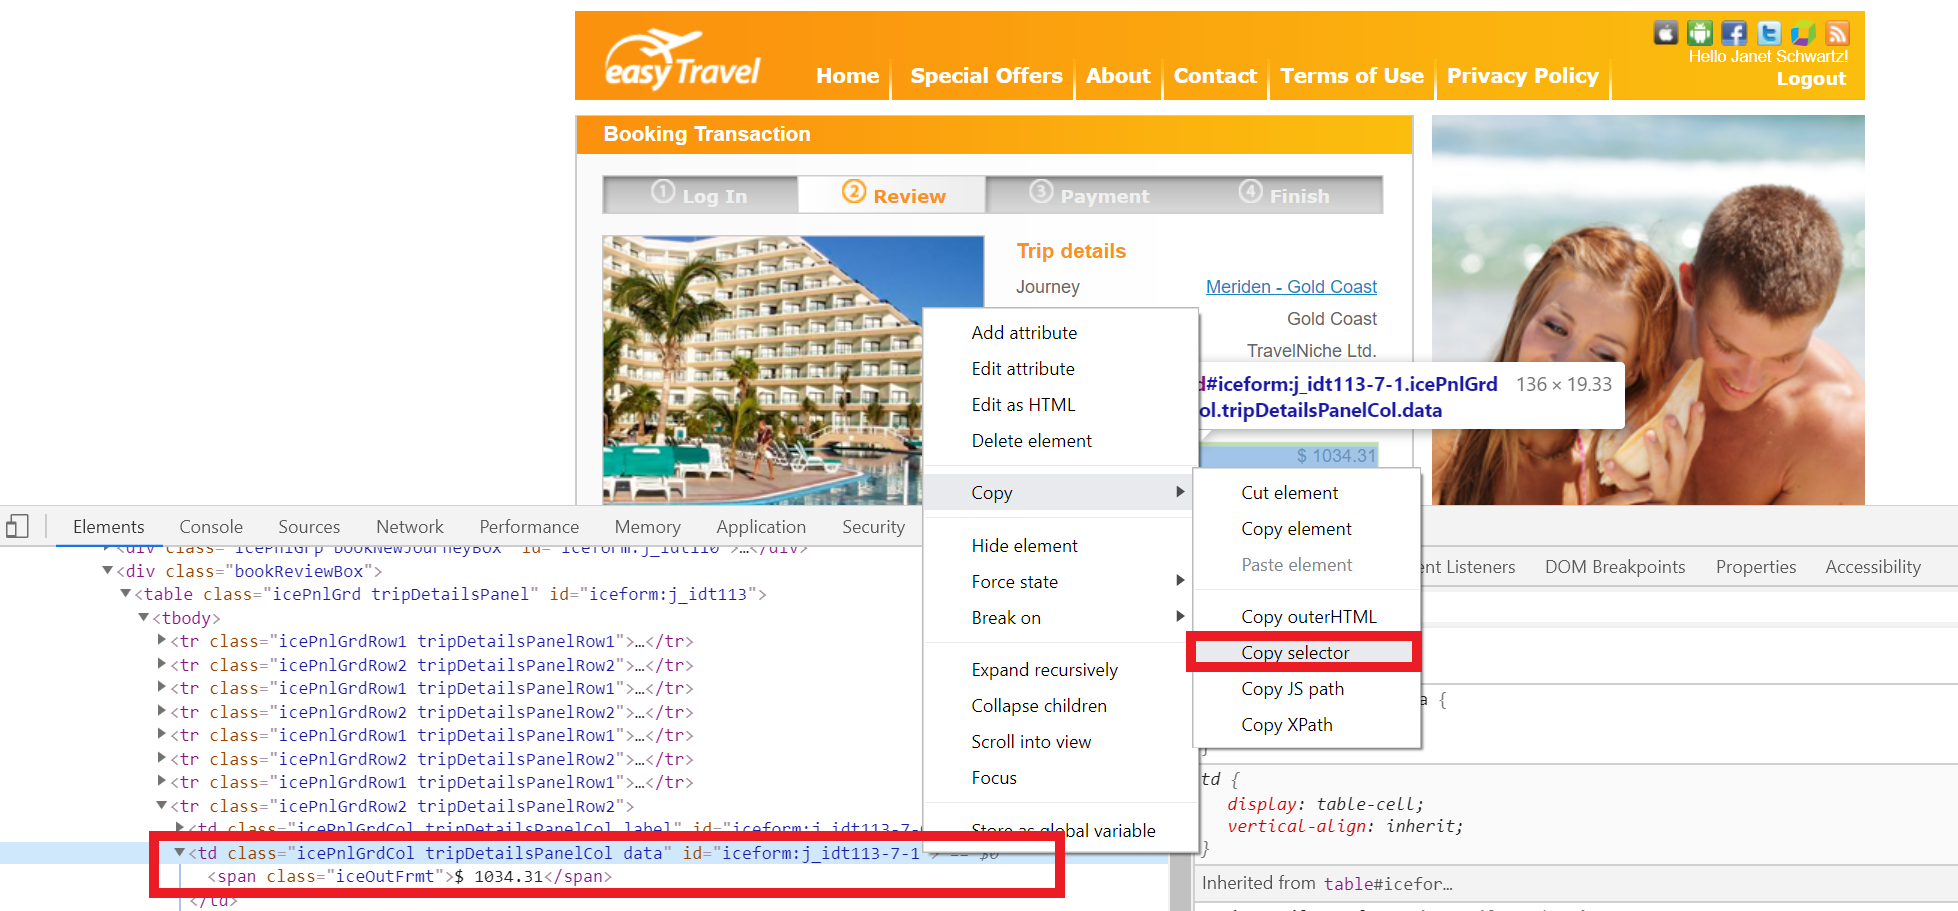
First get the CSS selector for the Booking Total field.
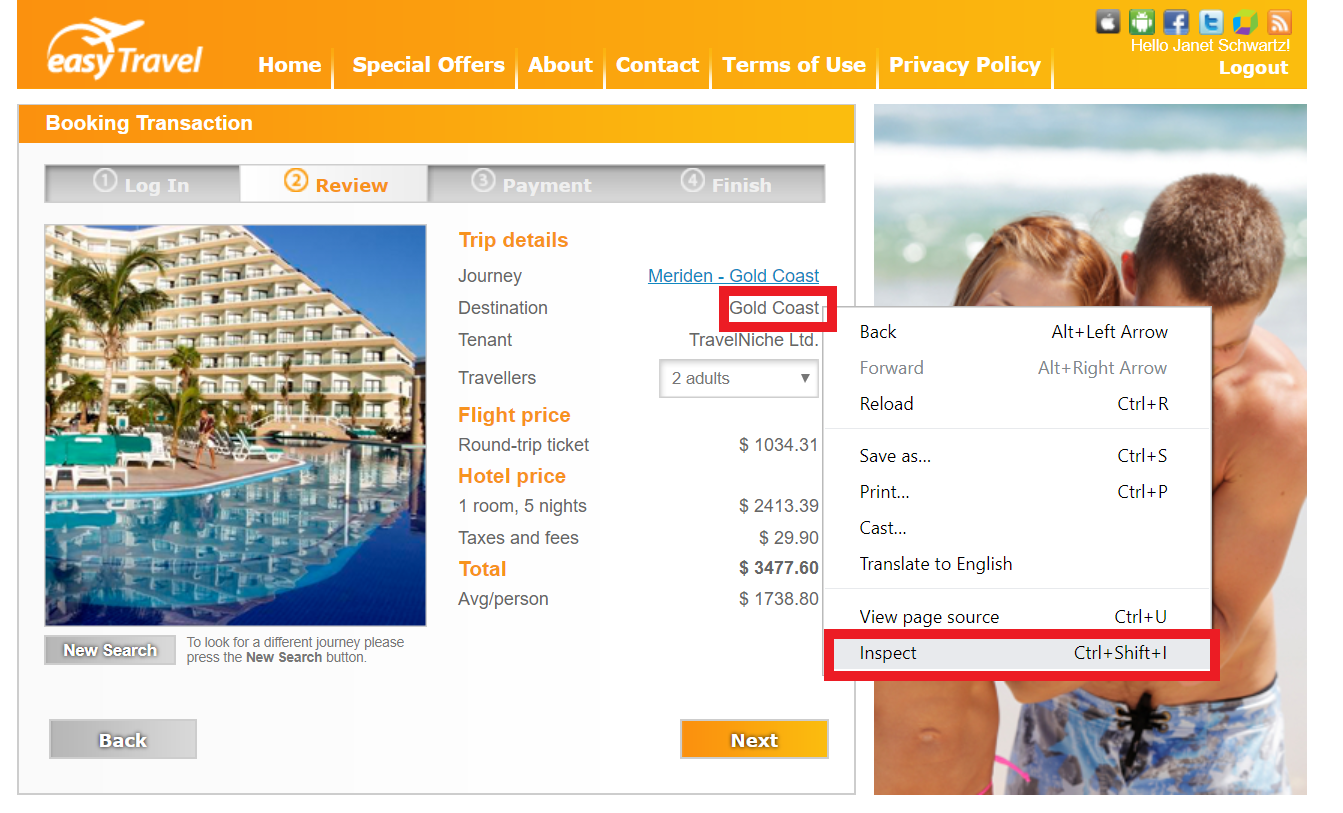
1) Assess the easyTravel homepage (the URL provied to you) 2) Seach for a destination e.g. Gold Coast and click Book Now
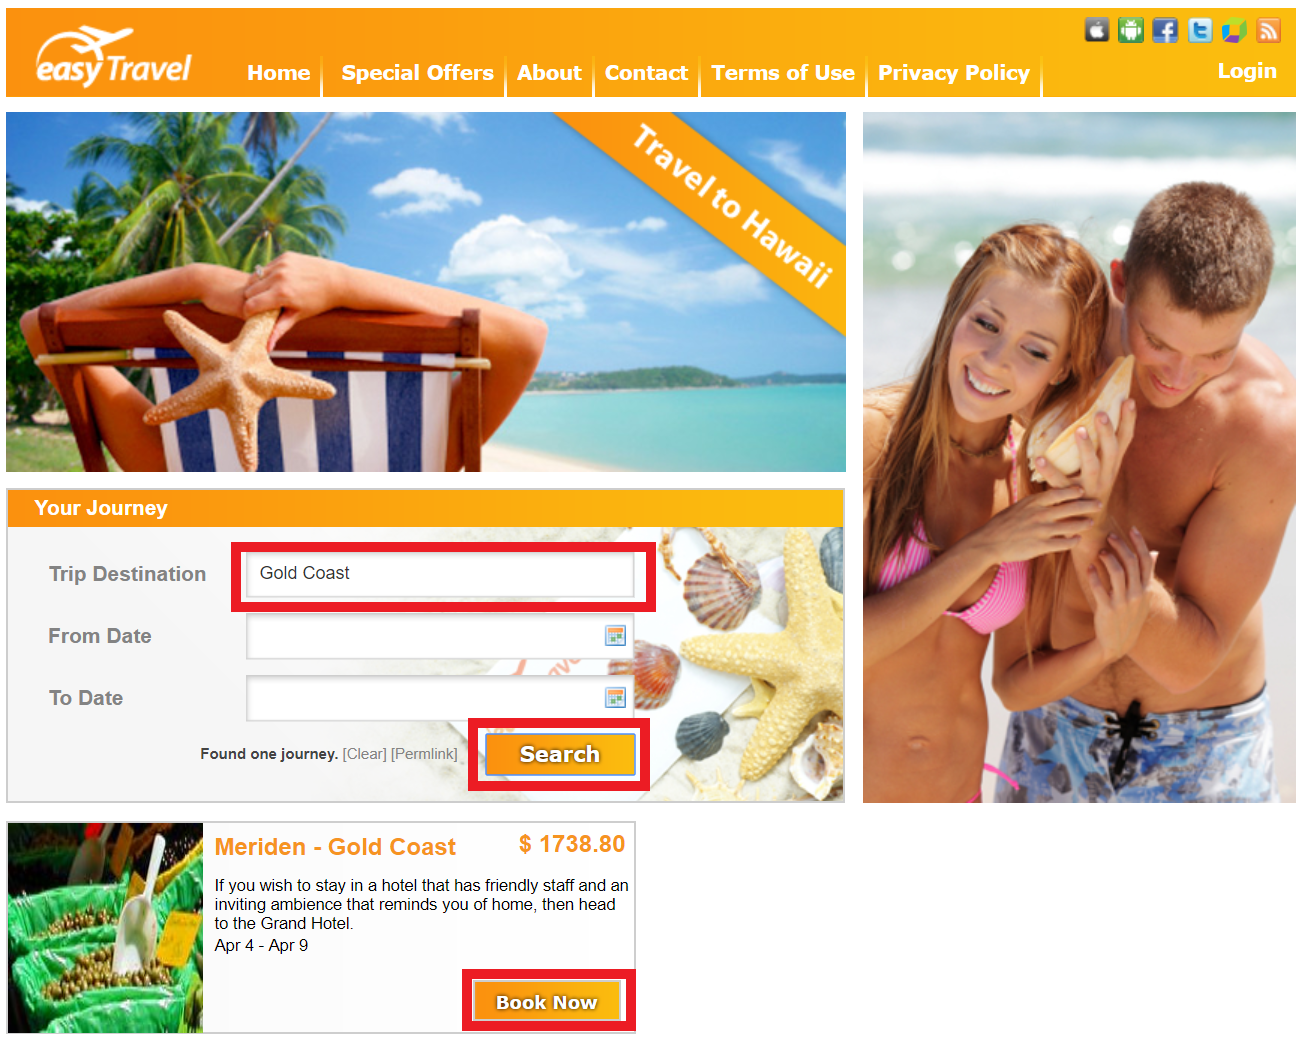
3) Login with username: janet and password: janet and click Next

4) Right click on the Round-trip ticket price $ value and click inspect
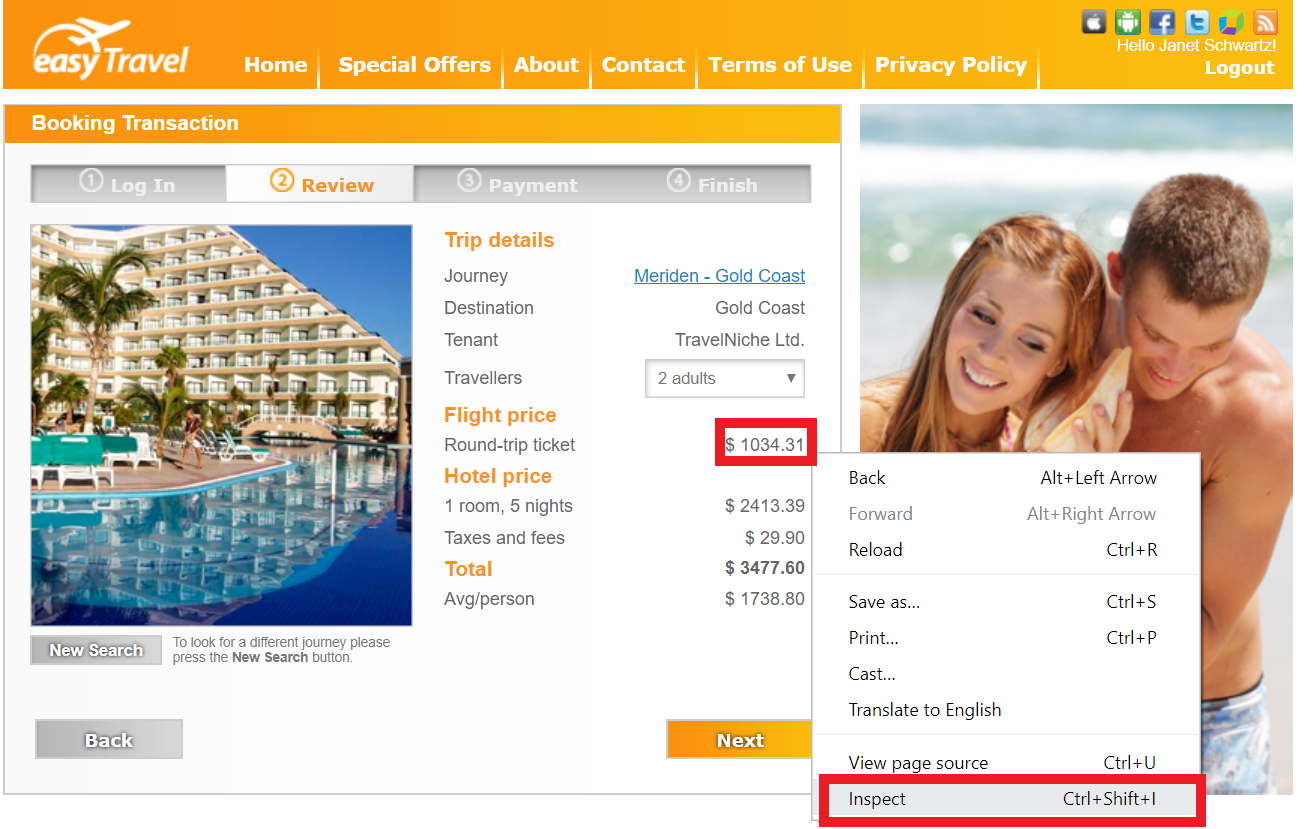
5) Right click on the td element and select Copy > Copy Selector
Second create the session property in Dynatrace.
1) Access the easyTravel application monitoring settings Applications > easyTravel > (...) Edit
2) Select Session and User action properties and click Custom defined property and enter the following:
- Expression Type: CSS Selector
- Data Type: Double
- CSS Selector: The CSS Selector you copied above e.g
#iceform\:j_idt77-11-1 > span - Display Name: Booking Total
- Key: bookingtotal
- Display Name: Booking Total
- Store as user action property: false
- Store as session property: true
- Apply cleanup rule: true
- Cleanup Rule Regex:
\$(.*+)
You can view the user sessions that have the booking total value by running the following USQL:
SELECT * FROM usersession WHERE doubleProperties.bookingtotal IS NOT NULL ORDER BY startTime DESC
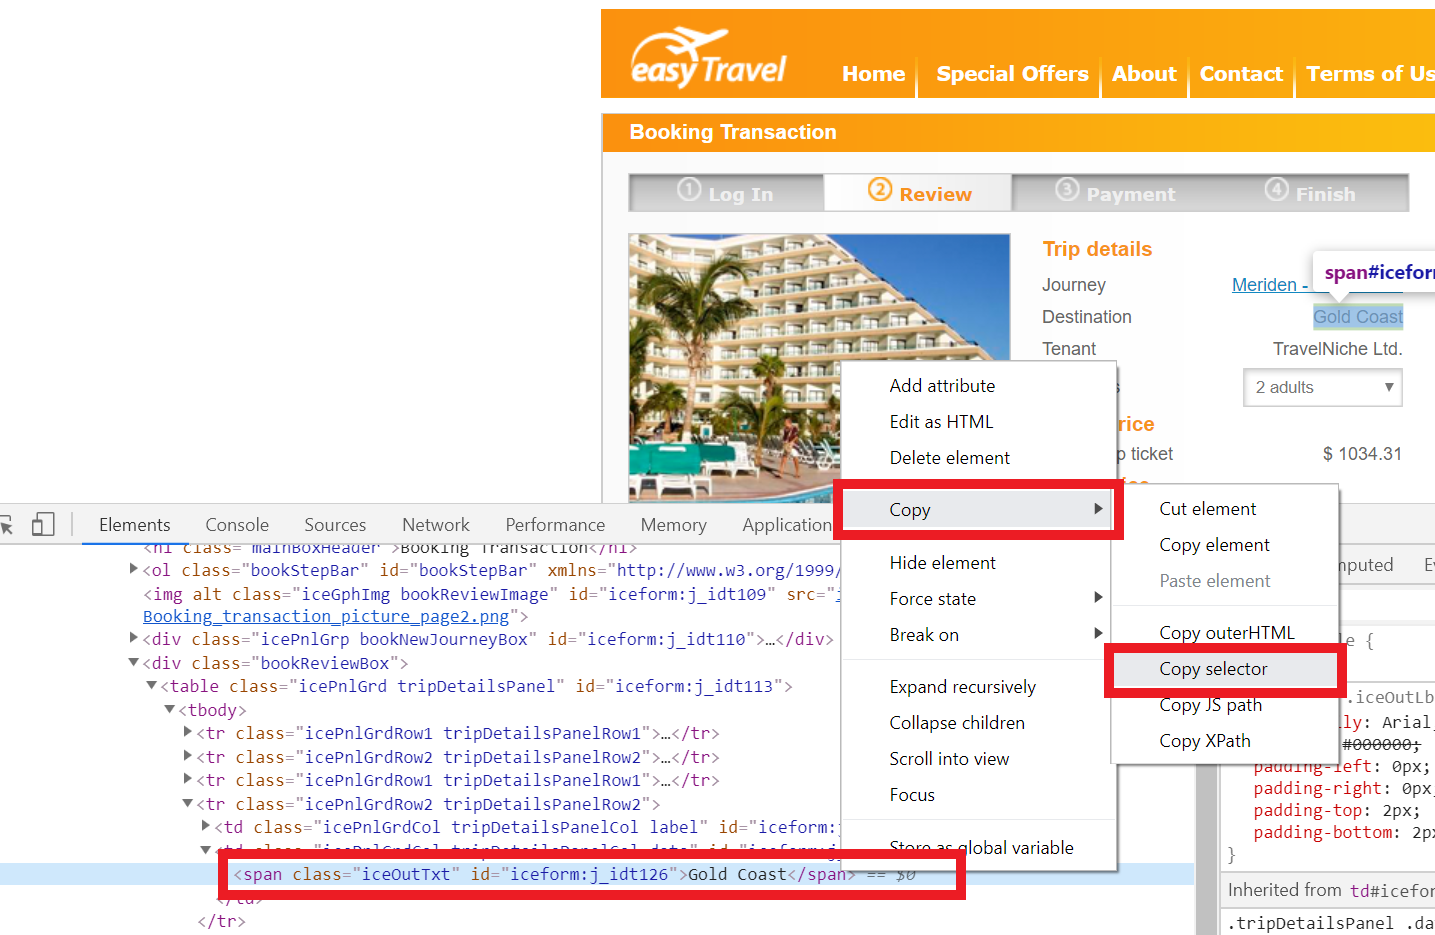
Trip Journey
For the trip Journey, back in easyTravel:
1) Right click on the Journey value and click inspect
2) Right click on the span element and select Copy > Copy Selector
Create the session property in Dynatrace.
1) Select Session and User action properties and click Custom defined property and enter the following:
- Expression Type: CSS Selector
- Data Type: String
- CSS Selector: The CSS Selector you copied above e.g.
#iceform\:popupDetailsLink - Display Name: Journey
- Key: journey
- Store as user action property: false
- Store as session property: true
- Apply cleanup rule: false
You can view the user sessions that have the destination value by running the following USQL:
SELECT * FROM usersession WHERE stringProperties.journey IS NOT NULL ORDER BY startTime DESC
It may take 5-10 mins to see results in Dynatrace because session properties are only available when the user session is completed.
Creating a Basic USQL Dashboard
In this lab, we will create the following dashboard:
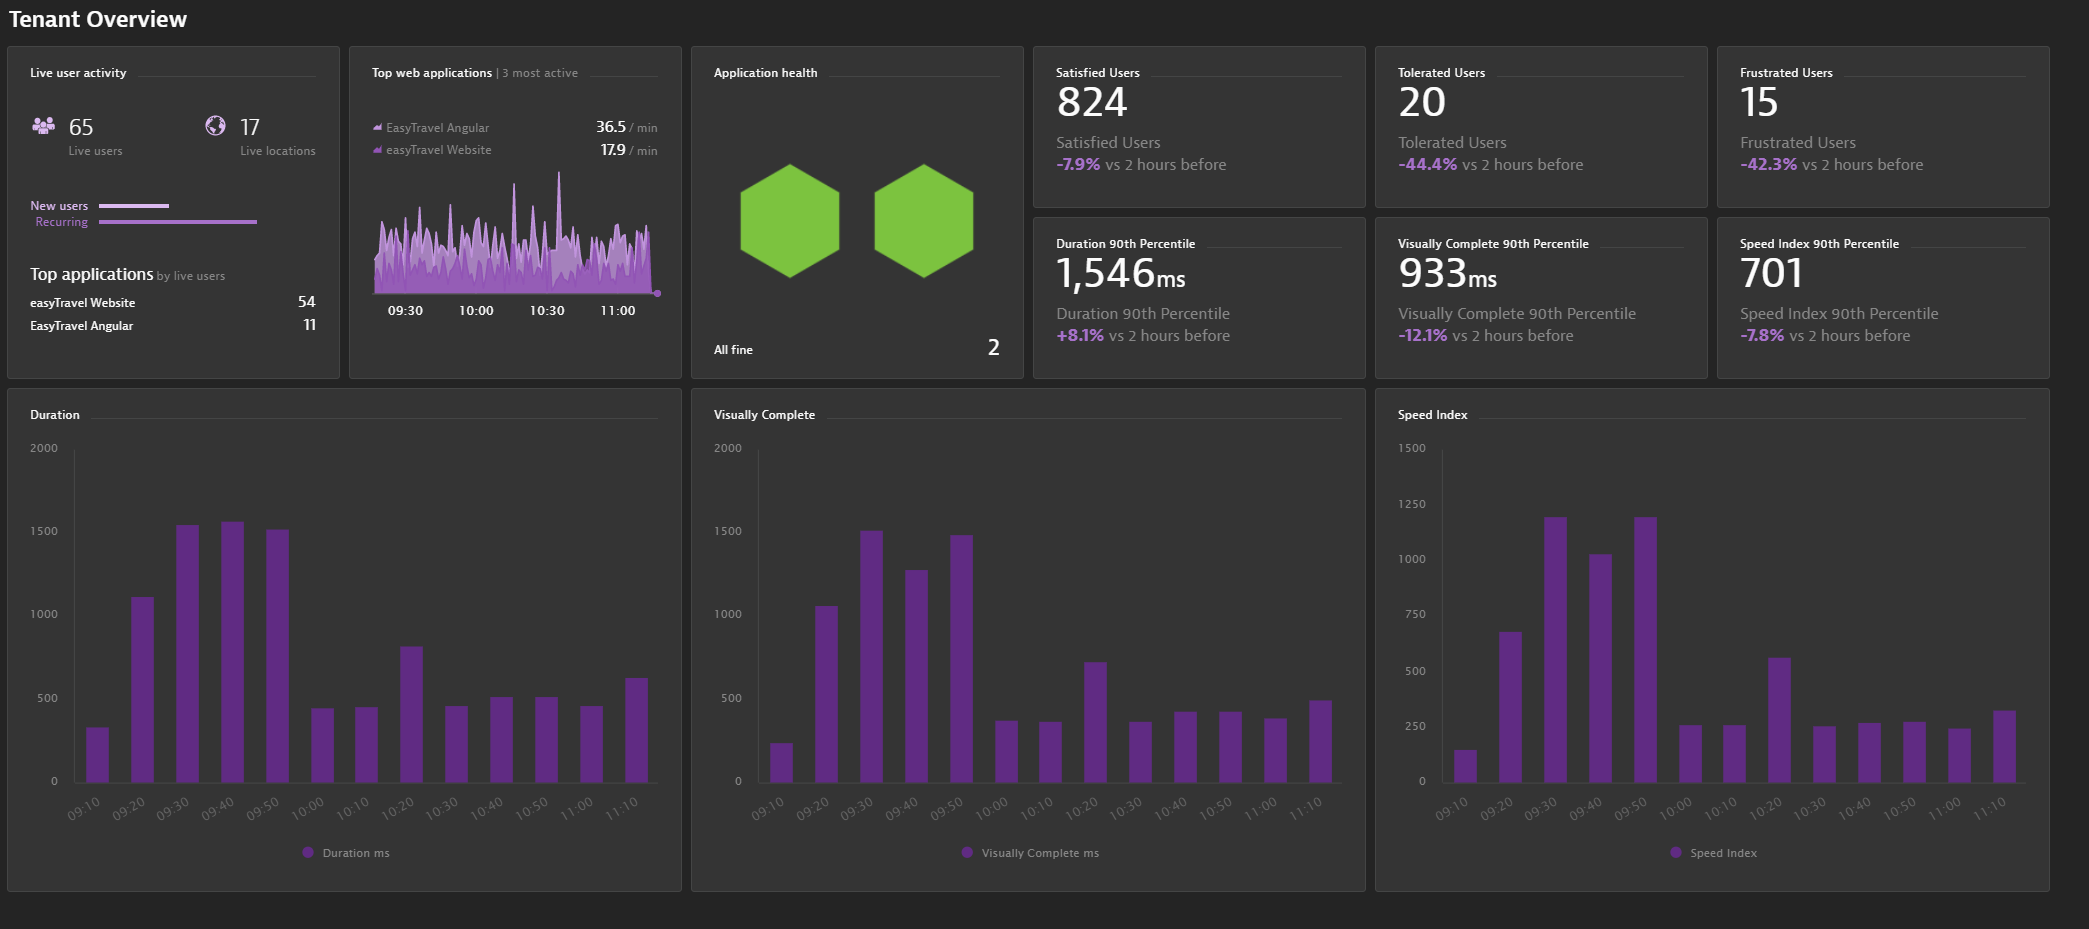
Dashboard Components
The above dashboard has the following components:
Out of the Box Tiles:
- Live user activity
- Top web applications
- Application health
USQL Tiles:
Single Value Tiles
- Satisfied Users
- USQL Category: select count(usersessionid) as "Satisfied Users" from usersession where userExperienceScore="SATISFIED"
- Compare with previous timeframe: true
- Dynamic time-frame shift: true
- Visualization types: Single value
- Tolerated Users
- USQL Category: select count(usersessionid) as "Tolerated Users" from usersession where userExperienceScore="TOLERATED"
- Compare with previous timeframe: true
- Dynamic time-frame shift: true
- Visualization types: Single value
- Frustrated Users
- USQL Category: select count(usersessionid) as "Frustrated Users" from usersession where userExperienceScore="FRUSTRATED"
- Compare with previous timeframe: true
- Dynamic time-frame shift: true
- Visualization types: Single value
- Duration 90th Percentile
- USQL Category: select PERCENTILE(duration,90) as "Duration 90th Percentile" from useraction
- Compare with previous timeframe: true
- Dynamic time-frame shift: true
- Visualization types: Single value
- Visually Complete 90th Percentile
- USQL Category: select PERCENTILE(visuallyCompleteTime,90) as "Visually Complete 90th Percentile" from useraction
- Compare with previous timeframe: true
- Dynamic time-frame shift: true
- Visualization types: Single value
- Speed Index 90th Percentile
- USQL Category: select PERCENTILE(speedIndex,90) as "Speed Index 90th Percentile" from useraction
- Compare with previous timeframe: true
- Dynamic time-frame shift: true
- Visualization types: Single value
Charts
- Duration
- USQL Category: select DISTINCT DATETIME(starttime, "HH:mm", "10m") as "Time", avg(useraction.duration) as "Duration" from useraction
- Compare with previous timeframe: false
- Visualization types: Bar chart
- Visually Complete
- USQL Category: select DISTINCT DATETIME(starttime, "HH:mm", "10m") as "Time", AVG(visuallyCompleteTime) as "Visually Complete" from useraction
- Compare with previous timeframe: false
- Visualization types: Bar chart
- Speed Index
- USQL Category: select DISTINCT DATETIME(starttime, "HH:mm", "10m") as "Time", AVG(speedIndex) as "Speed Index" from useraction
- Compare with previous timeframe: false
- Visualization types: Bar chart
In this lab, we will create the following dashboard:
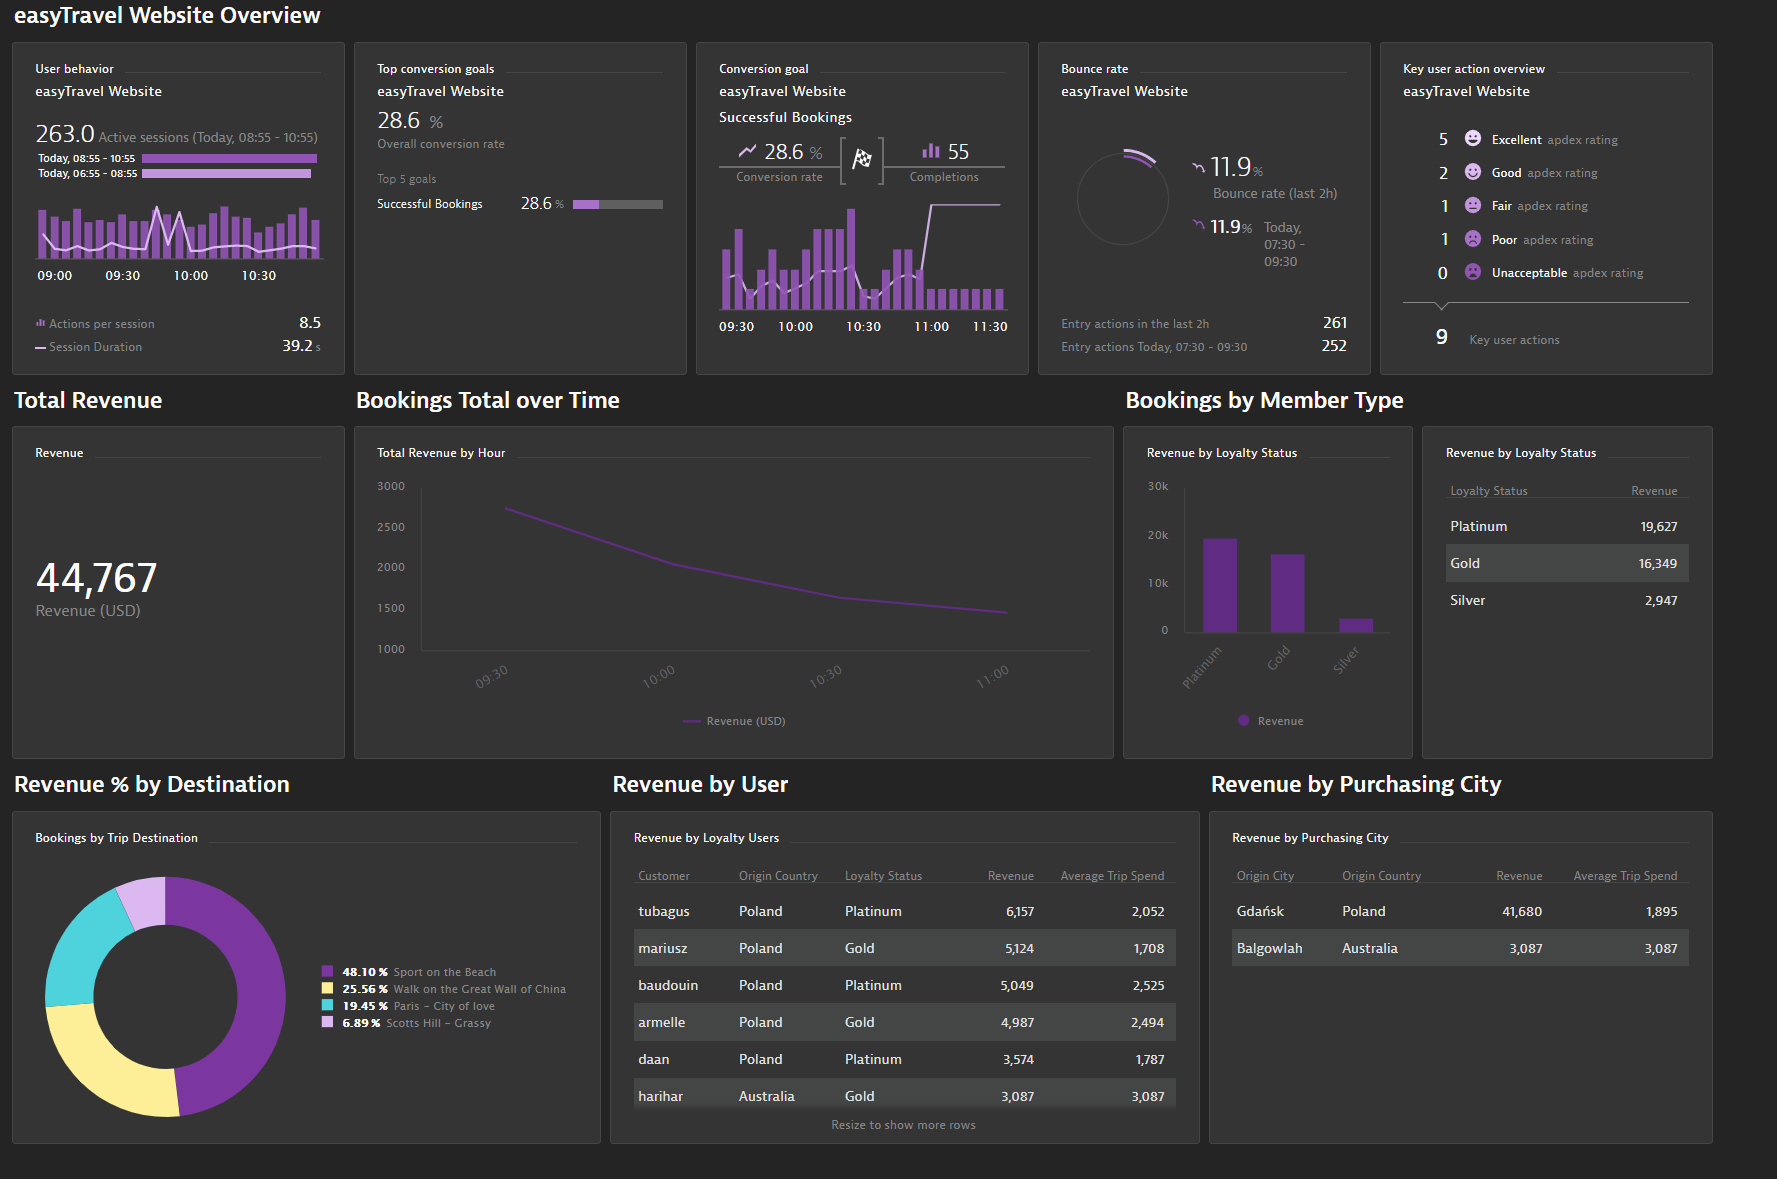
Dashboard Components
The above dashboard has the following components:
1) User Behavior > easyTravel Website
2) Top conversion goals > easyTravel Website
3) Conversion goal > easyTravel Website > Sucessful Bookings
4) Bounce Rate > easyTravel Website
5) Key user actions > easyTravel Website
6) User Session Query - Revenue
SELECT SUM(doubleProperties.bookingtotal) AS "Revenue (USD)" FROM usersession WHERE useraction.application="easyTravel Website" and (useraction.name="loading of page /orange-booking-finish.jsf")
7) User Session Query - Total Revenue by Hour
SELECT DISTINCT DATETIME(starttime, "HH:mm", "30m") as "Time",AVG(usersession.doubleProperties.bookingtotal) AS "Revenue (USD)" FROM usersession WHERE useraction.application="easyTravel Website" and (useraction.name="loading of page /orange-booking-finish.jsf")
8) User Session Query - Revenue by Loyalty Status - Chart
SELECT usersession.stringProperties.membershipstatus, SUM(usersession.doubleProperties.bookingtotal) AS "Revenue" FROM usersession WHERE useraction.application="easyTravel Website" and (useraction.name="loading of page /orange-booking-finish.jsf") and usersession.stringProperties.membershipstatus IS NOT NULL GROUP BY usersession.stringProperties.membershipstatus
9) User Session Query - Revenue by Loyalty Status - Table
SELECT usersession.stringProperties.membershipstatus AS "Loyalty Status", SUM(usersession.doubleProperties.bookingtotal) AS "Revenue" FROM usersession WHERE useraction.application="easyTravel Website" and (useraction.name="loading of page /orange-booking-finish.jsf") and usersession.stringProperties.membershipstatus IS NOT NULL GROUP BY usersession.stringProperties.membershipstatus
10) User Session Query - Bookings by Trip Destination
SELECT usersession.stringProperties.journey, SUM(usersession.doubleProperties.bookingtotal) FROM usersession WHERE useraction.application="easyTravel Website" and (useraction.name="loading of page /orange-booking-finish.jsf") and usersession.stringProperties.journey IS NOT NULL GROUP BY usersession.stringProperties.journey
11) User Session Query - Revenue by Loyalty Users
SELECT userId AS "Customer", country AS "Origin Country", stringProperties.membershipstatus AS "Loyalty Status", SUM(doubleProperties.bookingtotal) AS "Revenue", AVG(doubleProperties.bookingtotal) AS "Average Trip Spend" FROM usersession WHERE useraction.application="easyTravel Website" and (useraction.name="loading of page /orange-booking-finish.jsf") and doubleProperties.bookingtotal IS NOT NULL AND CITY IS NOT NULL AND userId IS NOT NULL AND stringProperties.membershipstatus IN ("Gold", "Platinum", "Silver") GROUP BY userId, country, stringProperties.membershipstatus ORDER BY sum(doubleProperties.bookingtotal) DESC
12) User Session Query - Revenue by Purchasing City
SELECT city AS "Origin City", country AS "Origin Country", SUM(doubleProperties.bookingtotal) AS "Revenue", AVG(doubleProperties.bookingtotal) AS "Average Trip Spend" FROM usersession WHERE useraction.application="easyTravel Website" and (useraction.name="loading of page /orange-booking-finish.jsf") and doubleProperties.bookingtotal IS NOT NULL AND CITY IS NOT NULL GROUP BY city, country ORDER BY sum(doubleProperties.bookingtotal) DESC
In this lab, we will create a dashboard to display a basic sales funnel.
In the Dynatrace UI, create a new dashboard named "Sales Funnel" (Dashboards > Create Dashboard)
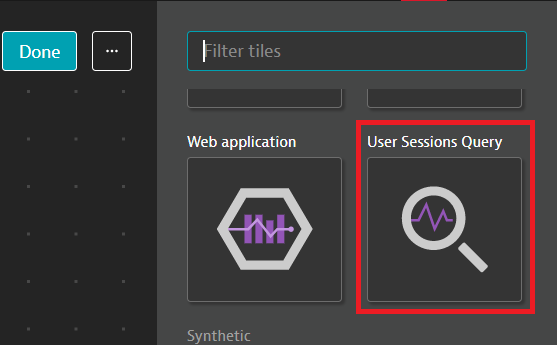
- Add the User Sessions Query to the dashboard and configure the tile
- Enter the UQSL as follows
select count(*) as "Homepage Requests" from usersession where useraction.name = "loading of page /orange.jsf"
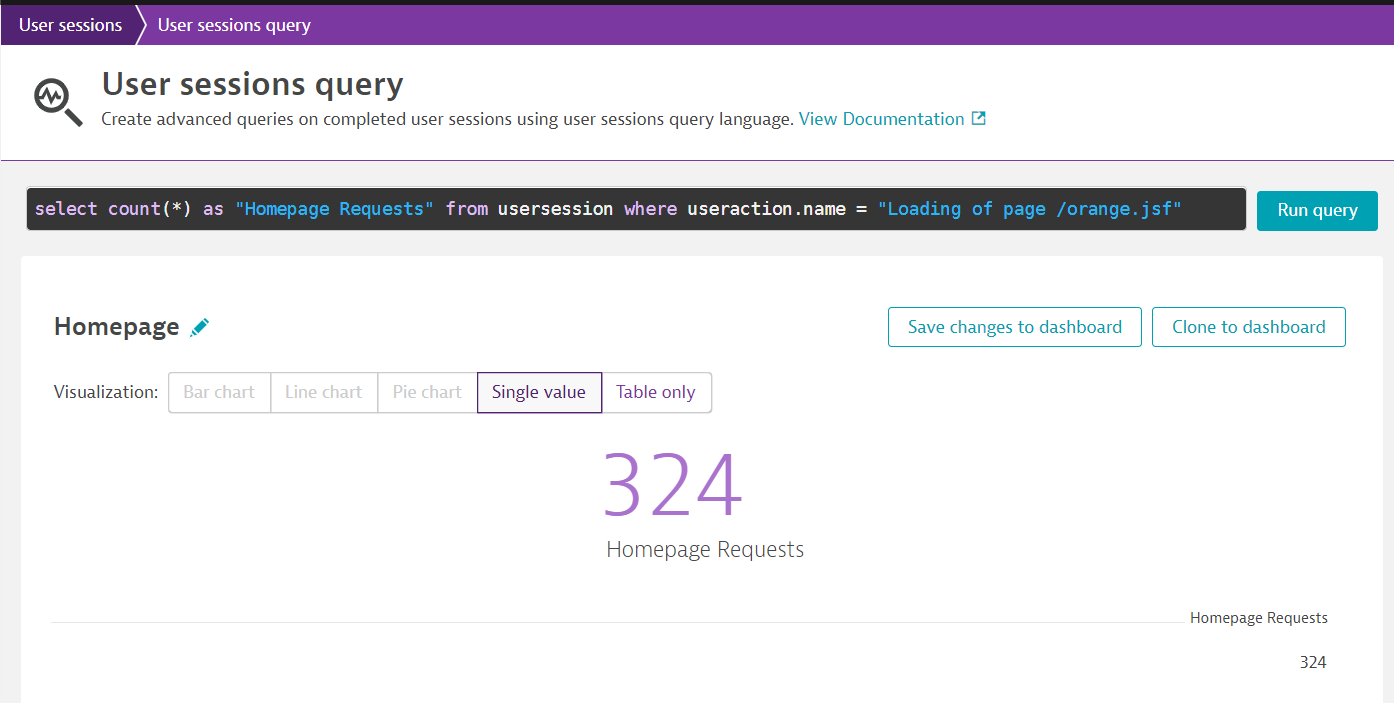
- Click on "Save Changes to dashboard"
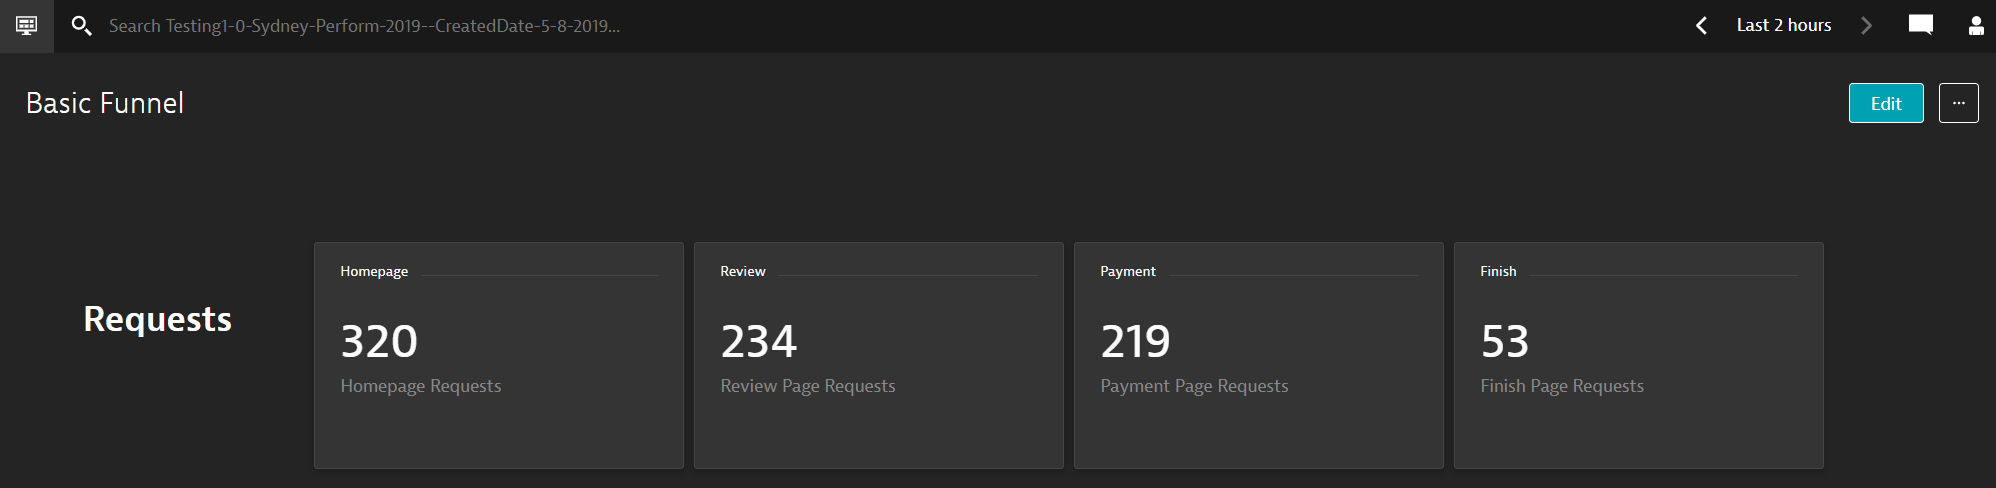
- Repeat the above steps to create dashboard tiles for:
Review Page:
select count(*) as "Review Page Requests" from usersession where useraction.name="loading of page /orange.jsf" and useraction.name="loading of page /orange-booking-review.jsf"
Payment Page:
select count(*) as "Payment Page Requests" from usersession where useraction.name="loading of page /orange.jsf" and useraction.name="loading of page /orange-booking-review.jsf" and useraction.name="loading of page /orange-booking-payment.jsf"
Finish Page:
select count(*) as "Finish Page Requests" from usersession where useraction.name="loading of page /orange.jsf" and useraction.name="loading of page /orange-booking-review.jsf" and useraction.name="loading of page /orange-booking-payment.jsf" and useraction.name="loading of page /orange-booking-finish.jsf"
When you are finished your dashboard should look something like this:
In this lab, we will create a dashsboard using the Dashboard API.
You will need an API token with the Read configuration and Write Configuration permissions for this session.
Step-by-step Guide - Access API Explorer
In the Dynatrace dashboard, navigate to the Configuration API: Settings -> Integration -> Dynatrace API > Dynatrace API Explorer
Select Configuration API from the top right drop down menu.
Authorise ReadConfigToken (apiKey) and WriteConfigToken (apiKey) for this session.
Step-by-step Guide - Create Dashboard using API
- In the API list select Dashboards
- Select POST /dashboards
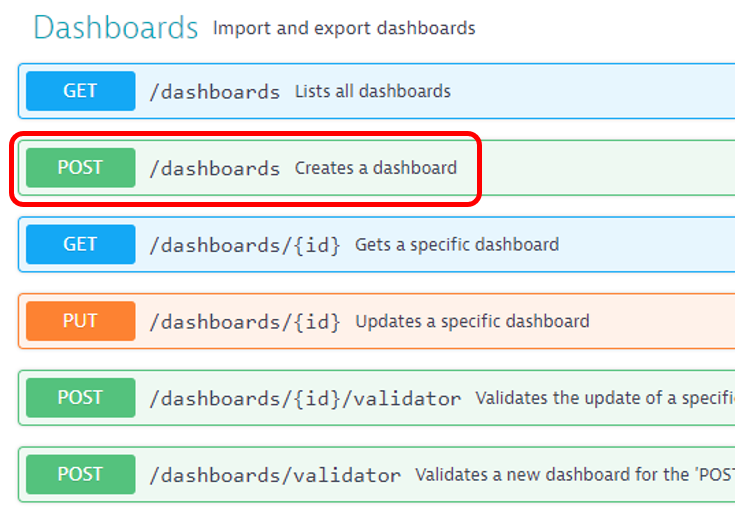
- Select Try it Out
- The following json will create a dashboard. Copy the JSON into the Example Value field
{
  "dashboardMetadata": {
    "name": "Executive Overview Dashboard",
    "shared": false,
    "sharingDetails": {
      "linkShared": true,
      "published": false
    },
    "dashboardFilter": {
      "timeframe": "l_2_HOURS",
      "managementZone": null
    }
  },
  "tiles": [
    {
      "name": "Top web applications",
      "tileType": "APPLICATIONS_MOST_ACTIVE",
      "configured": true,
      "bounds": {
        "top": 494,
        "left": 0,
        "width": 304,
        "height": 304
      },
      "tileFilter": {
        "managementZone": null
      }
    },
    {
      "name": "Overview",
      "tileType": "HEADER",
      "configured": true,
      "bounds": {
        "top": 0,
        "left": 0,
        "width": 304,
        "height": 38
      },
      "tileFilter": {
        "managementZone": null
      }
    },
    {
      "name": "Problems",
      "tileType": "OPEN_PROBLEMS",
      "configured": true,
      "bounds": {
        "top": 38,
        "left": 0,
        "width": 152,
        "height": 152
      },
      "tileFilter": {
        "managementZone": null
      }
    },
    {
      "name": "Service health",
      "tileType": "SERVICES",
      "configured": true,
      "bounds": {
        "top": 798,
        "left": 152,
        "width": 152,
        "height": 152
      },
      "tileFilter": {
        "managementZone": null
      },
      "filterConfig": null,
      "chartVisible": true
    },
    {
      "name": "Host health",
      "tileType": "HOSTS",
      "configured": true,
      "bounds": {
        "top": 798,
        "left": 0,
        "width": 152,
        "height": 152
      },
      "tileFilter": {
        "managementZone": null
      },
      "filterConfig": null,
      "chartVisible": true
    },
    {
      "name": "Application health",
      "tileType": "APPLICATIONS",
      "configured": true,
      "bounds": {
        "top": 38,
        "left": 152,
        "width": 152,
        "height": 152
      },
      "tileFilter": {
        "managementZone": null
      },
      "filterConfig": null,
      "chartVisible": true
    },
    {
      "name": "World map",
      "tileType": "APPLICATION_WORLDMAP",
      "configured": true,
      "bounds": {
        "top": 38,
        "left": 380,
        "width": 304,
        "height": 304
      },
      "tileFilter": {
        "managementZone": null
      },
      "assignedEntities": [
        "APPLICATION-534A6A58D004195A"
      ],
      "metric": "APDEX"
    },
    {
      "name": "User behavior",
      "tileType": "SESSION_METRICS",
      "configured": true,
      "bounds": {
        "top": 342,
        "left": 380,
        "width": 304,
        "height": 304
      },
      "tileFilter": {
        "managementZone": null
      },
      "assignedEntities": [
        "APPLICATION-534A6A58D004195A"
      ]
    },
    {
      "name": "User breakdown",
      "tileType": "USERS",
      "configured": true,
      "bounds": {
        "top": 342,
        "left": 684,
        "width": 304,
        "height": 304
      },
      "tileFilter": {
        "managementZone": null
      },
      "assignedEntities": [
        "APPLICATION-534A6A58D004195A"
      ]
    },
    {
      "name": "Bounce rate",
      "tileType": "BOUNCE_RATE",
      "configured": true,
      "bounds": {
        "top": 342,
        "left": 988,
        "width": 304,
        "height": 304
      },
      "tileFilter": {
        "managementZone": null
      },
      "assignedEntities": [
        "APPLICATION-534A6A58D004195A"
      ]
    },
    {
      "name": "JavaScript errors",
      "tileType": "UEM_JSERRORS_OVERALL",
      "configured": true,
      "bounds": {
        "top": 646,
        "left": 380,
        "width": 304,
        "height": 304
      },
      "tileFilter": {
        "managementZone": null
      },
      "assignedEntities": [
        "APPLICATION-534A6A58D004195A"
      ]
    },
    {
      "name": "Resources",
      "tileType": "RESOURCES",
      "configured": true,
      "bounds": {
        "top": 646,
        "left": 988,
        "width": 304,
        "height": 304
      },
      "tileFilter": {
        "managementZone": null
      },
      "assignedEntities": [
        "APPLICATION-534A6A58D004195A"
      ],
      "metric": "ACTION_COUNT"
    },
    {
      "name": "Most used 3rd parties",
      "tileType": "THIRD_PARTY_MOST_ACTIVE",
      "configured": true,
      "bounds": {
        "top": 646,
        "left": 684,
        "width": 304,
        "height": 304
      },
      "tileFilter": {
        "managementZone": null
      },
      "assignedEntities": [
        "APPLICATION-534A6A58D004195A"
      ],
      "metric": "ACTION_COUNT"
    },
    {
      "name": "Live user activity",
      "tileType": "UEM_ACTIVE_SESSIONS",
      "configured": true,
      "bounds": {
        "top": 190,
        "left": 0,
        "width": 304,
        "height": 304
      },
      "tileFilter": {
        "managementZone": null
      }
    },
    {
      "name": "Web application",
      "tileType": "APPLICATION",
      "configured": true,
      "bounds": {
        "top": 38,
        "left": 988,
        "width": 304,
        "height": 304
      },
      "tileFilter": {
        "managementZone": null
      },
      "assignedEntities": [
        "APPLICATION-534A6A58D004195A"
      ]
    },
    {
      "name": "World map",
      "tileType": "APPLICATION_WORLDMAP",
      "configured": true,
      "bounds": {
        "top": 38,
        "left": 684,
        "width": 304,
        "height": 304
      },
      "tileFilter": {
        "managementZone": null
      },
      "assignedEntities": [
        "APPLICATION-534A6A58D004195A"
      ],
      "metric": "SESSION_USERS"
    },
    {
      "name": "Markdown",
      "tileType": "MARKDOWN",
      "configured": true,
      "bounds": {
        "top": 0,
        "left": 380,
        "width": 1254,
        "height": 38
      },
      "tileFilter": {
        "managementZone": null
      },
      "markdown": "##[easyTravel Production Overview](#uemapplications/uemappmetrics;uemapplicationId=APPLICATION-534A6A58D004195A)"
    },
    {
      "name": "Markdown",
      "tileType": "MARKDOWN",
      "configured": true,
      "bounds": {
        "top": 266,
        "left": 1330,
        "width": 304,
        "height": 38
      },
      "tileFilter": {
        "managementZone": null
      },
      "markdown": "### [Hosts Overview](#newhosts)\n\n"
    },
    {
      "name": "Markdown",
      "tileType": "MARKDOWN",
      "configured": true,
      "bounds": {
        "top": 38,
        "left": 1330,
        "width": 304,
        "height": 38
      },
      "tileFilter": {
        "managementZone": null
      },
      "markdown": "###[Services Overview](#newservices)"
    },
    {
      "name": "Markdown",
      "tileType": "MARKDOWN",
      "configured": true,
      "bounds": {
        "top": 494,
        "left": 1330,
        "width": 304,
        "height": 38
      },
      "tileFilter": {
        "managementZone": null
      },
      "markdown": "### [Database Overview](#databases)"
    },
    {
      "name": "",
      "tileType": "SERVICES",
      "configured": true,
      "bounds": {
        "top": 76,
        "left": 1330,
        "width": 152,
        "height": 190
      },
      "tileFilter": {
        "managementZone": null
      },
      "filterConfig": {
        "type": "SERVICE",
        "customName": "Java",
        "defaultName": "Java",
        "chartConfig": {
          "type": "TIMESERIES",
          "series": [],
          "resultMetadata": {}
        },
        "filtersPerEntityType": {
          "SERVICE": {
            "SERVICE_SOFTWARE_TECH": [
              "JAVA"
            ]
          }
        }
      },
      "chartVisible": true
    },
    {
      "name": "Markdown",
      "tileType": "MARKDOWN",
      "configured": true,
      "bounds": {
        "top": 722,
        "left": 1330,
        "width": 152,
        "height": 228
      },
      "tileFilter": {
        "managementZone": null
      },
      "markdown": "## Links\n---\n[Docker Overview](#docker)  \n[AWS Overview](#awses)  \n[Azure Overview](#azures)  \n[VMWare Overview](#vcenters)  \n[Network Overview](#networkoverview)"
    },
    {
      "name": "Markdown",
      "tileType": "MARKDOWN",
      "configured": true,
      "bounds": {
        "top": 722,
        "left": 1482,
        "width": 152,
        "height": 228
      },
      "tileFilter": {
        "managementZone": null
      },
      "markdown": "## Help\n---\n[Dynatrace Help](https://www.dynatrace.com/support/help/)  \n[Contact Support](https://www.dynatrace.com/support/contact-support/)  \n[What is Dynatrace?](https://www.dynatrace.com/support/help/get-started/what-is-dynatrace/)  \n[Dynatrace University](https://university.dynatrace.com/)  \n[Dynatrace Youtube](https://www.youtube.com/channel/UCcYJ-5q_AfmjQ4XTjTS0o3g)"
    },
    {
      "name": "",
      "tileType": "SERVICES",
      "configured": true,
      "bounds": {
        "top": 76,
        "left": 1482,
        "width": 152,
        "height": 190
      },
      "tileFilter": {
        "managementZone": null
      },
      "filterConfig": {
        "type": "SERVICE",
        "customName": "Nginx Services",
        "defaultName": "Nginx Services",
        "chartConfig": {
          "type": "TIMESERIES",
          "series": [],
          "resultMetadata": {}
        },
        "filtersPerEntityType": {
          "SERVICE": {
            "SERVICE_SOFTWARE_TECH": [
              "NGINX"
            ]
          }
        }
      },
      "chartVisible": true
    },
    {
      "name": "",
      "tileType": "HOSTS",
      "configured": true,
      "bounds": {
        "top": 304,
        "left": 1330,
        "width": 304,
        "height": 190
      },
      "tileFilter": {
        "managementZone": null
      },
      "filterConfig": {
        "type": "HOST",
        "customName": "AWS Hosts",
        "defaultName": "AWS Hosts",
        "chartConfig": {
          "type": "TIMESERIES",
          "series": [],
          "resultMetadata": {}
        },
        "filtersPerEntityType": {
          "HOST": {
            "HOST_VIRTUALIZATION": [
              "1"
            ]
          }
        }
      },
      "chartVisible": true
    },
    {
      "name": "",
      "tileType": "DATABASES_OVERVIEW",
      "configured": true,
      "bounds": {
        "top": 532,
        "left": 1330,
        "width": 304,
        "height": 190
      },
      "tileFilter": {
        "managementZone": null
      },
      "filterConfig": {
        "type": "DATABASE",
        "customName": "Databases",
        "defaultName": "Databases",
        "chartConfig": {
          "type": "TIMESERIES",
          "series": [],
          "resultMetadata": {}
        },
        "filtersPerEntityType": {}
      },
      "chartVisible": true
    }
  ]
}
- Select Execute, to create your browser test.
The server response should be response code 201 with a response body like the following:
{
  "id": "8f721746-8e2b-40fe-bd3b-61c1657d59df",
  "name": "Executive Overview Dashboard"
}
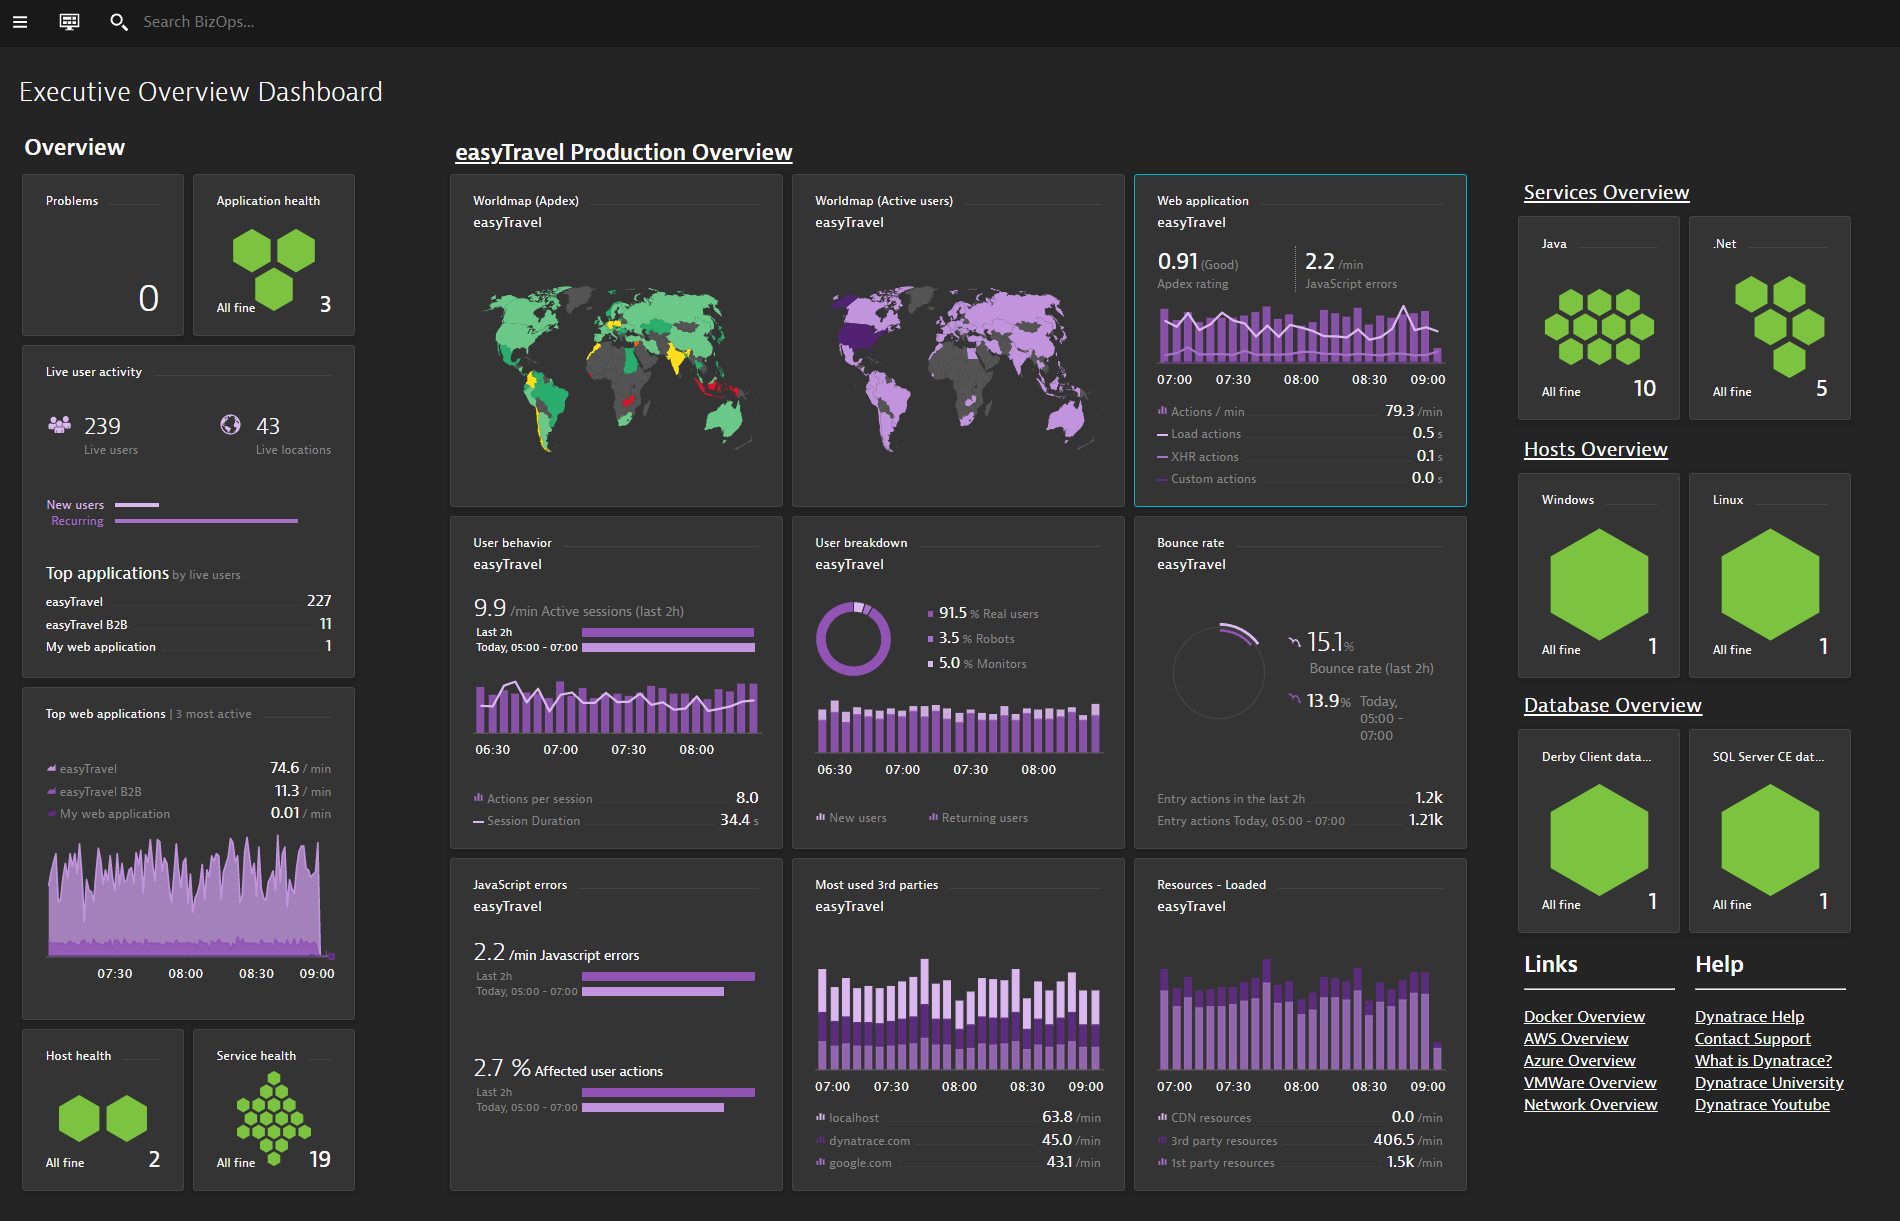
Navigate back to the Dynatrace dashboards. The dashboard should look something like this:
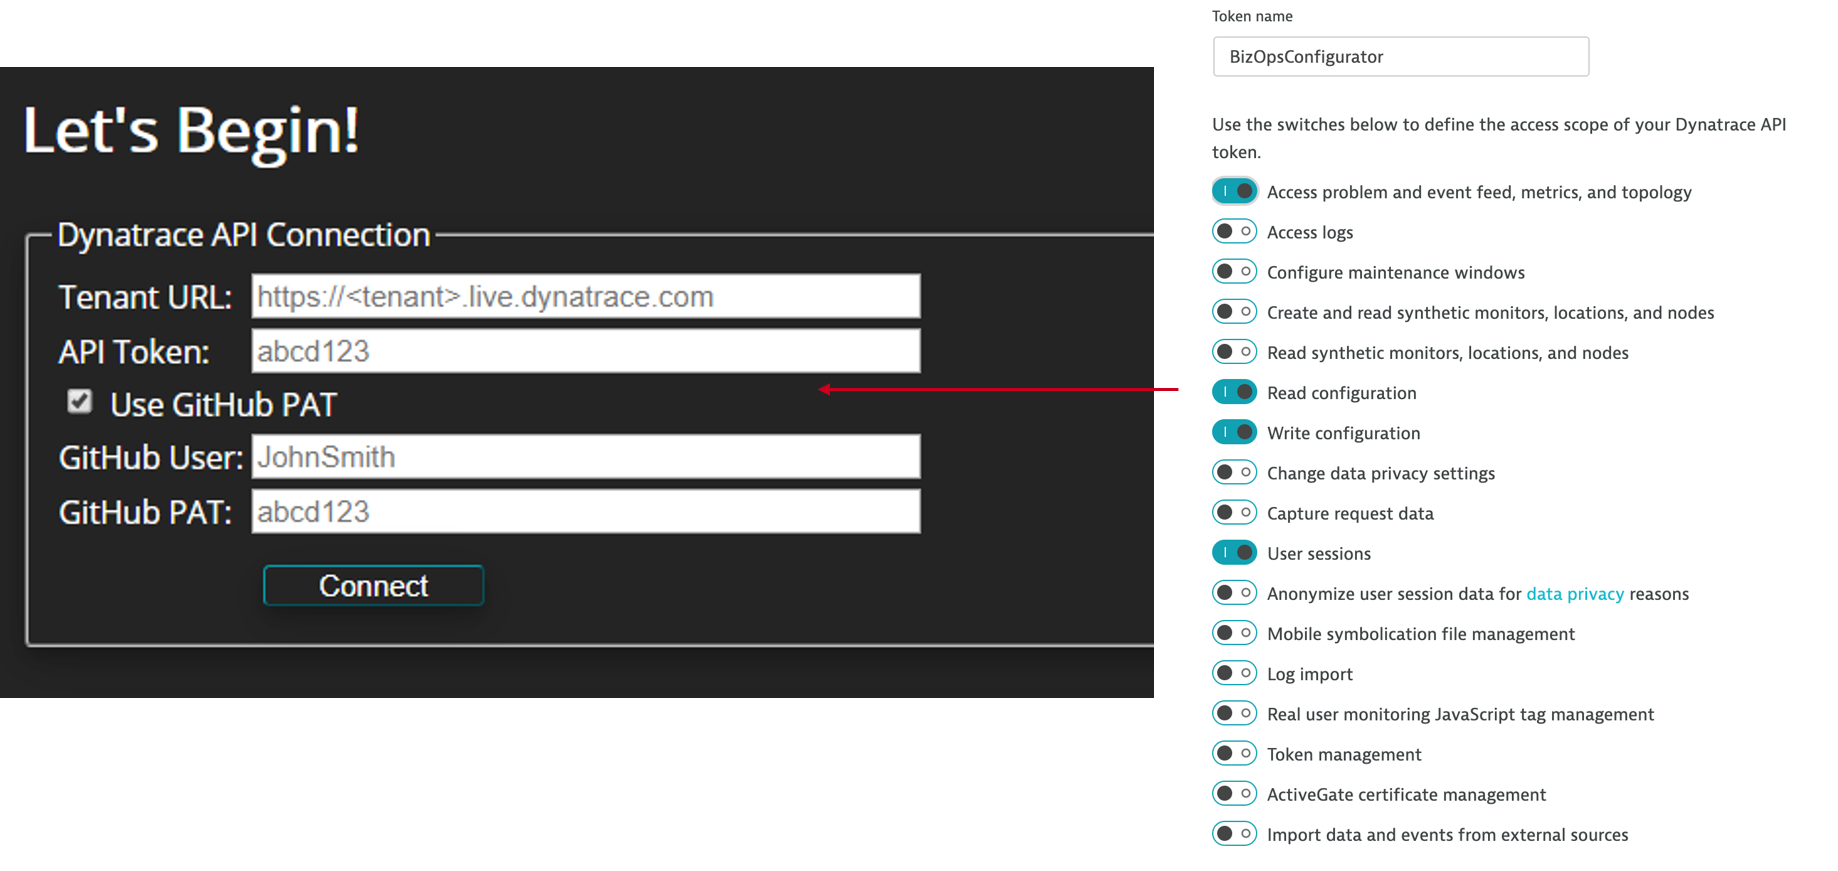
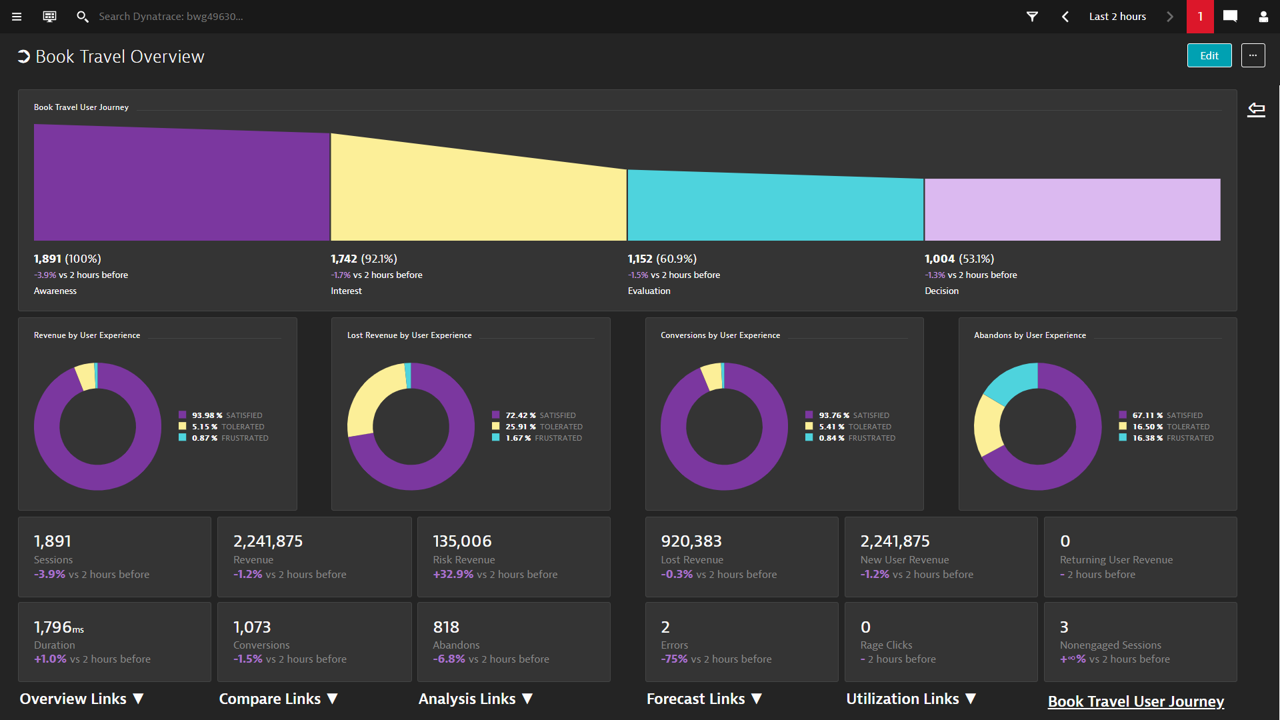
Go to the BizOps Configurator URL.
Follow the Step 2 instructions on the BizOps Prereqs page to setup your API Token.
Click on Begin and provide your tenant URL and API token.
Please clone the repository or create a Personal Access Token if you plan to use the BizOps Configurator to avoid hitting GitHub API limits
Click on Deploy Tenant Overview and select the BizOps Template
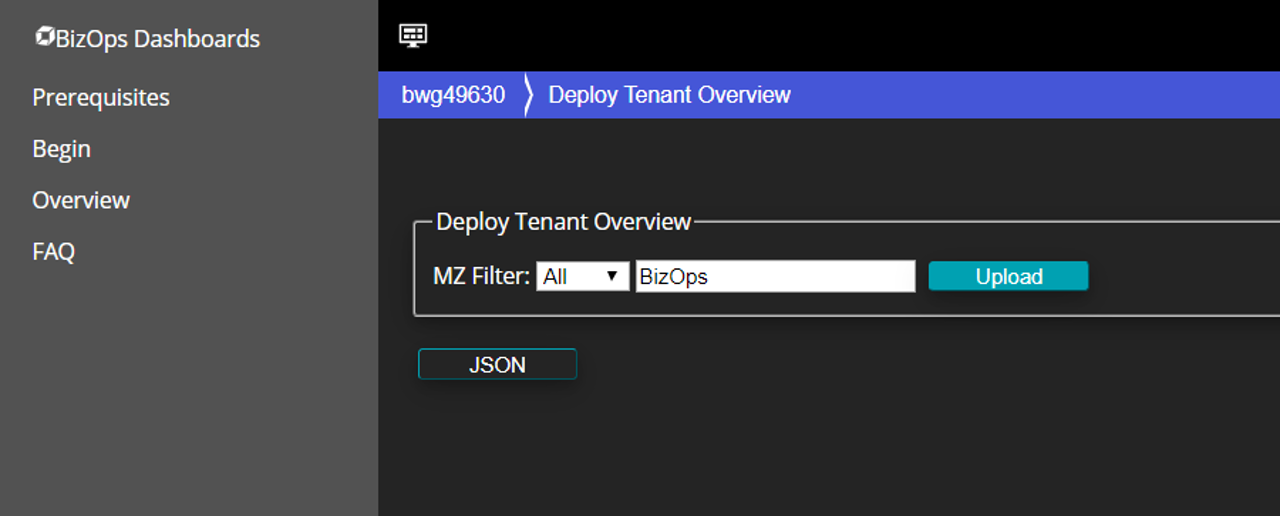
Click on Deploy App Overview and select Easytravel for the dropdown for both App Overview and Release overview. Click Upload
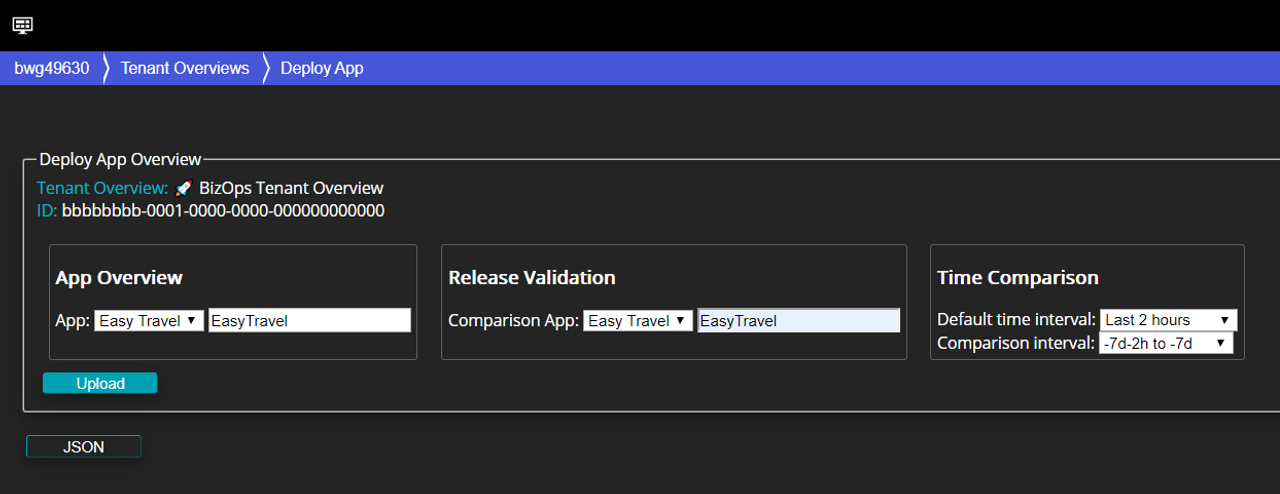
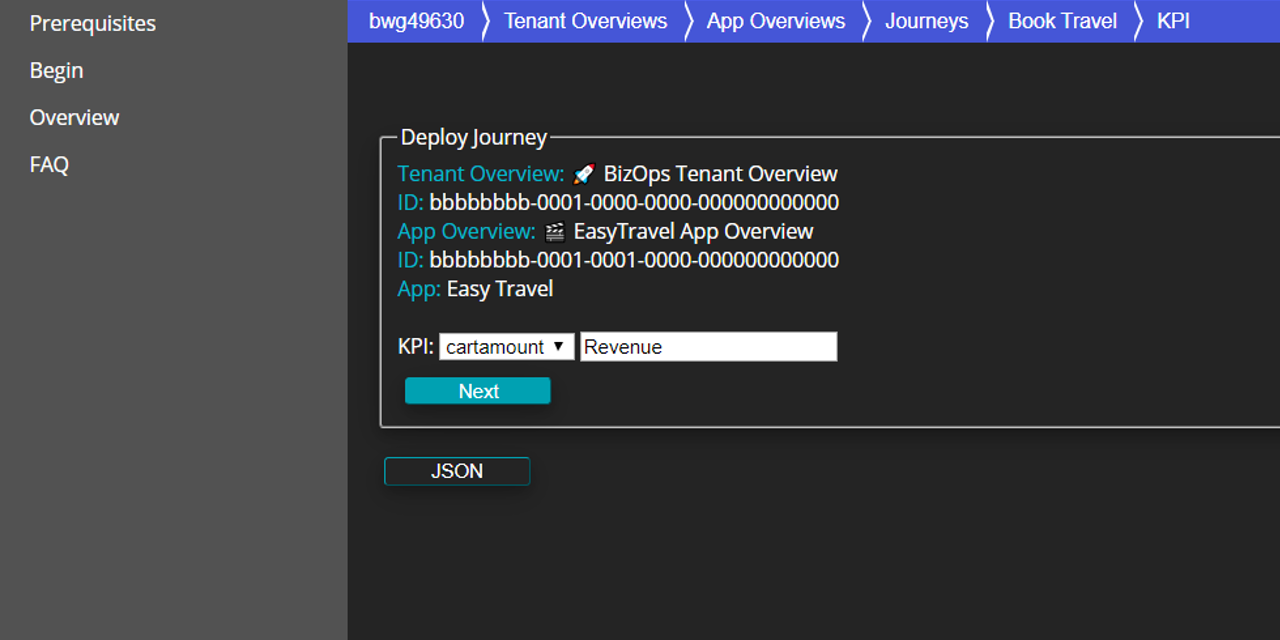
Click on Deploy Journey, use "Book Travel" under Journey Name and select cartamount for KPI with Revenue as name.
Drag the Key User Actions to the funnel to build out the funnel steps.
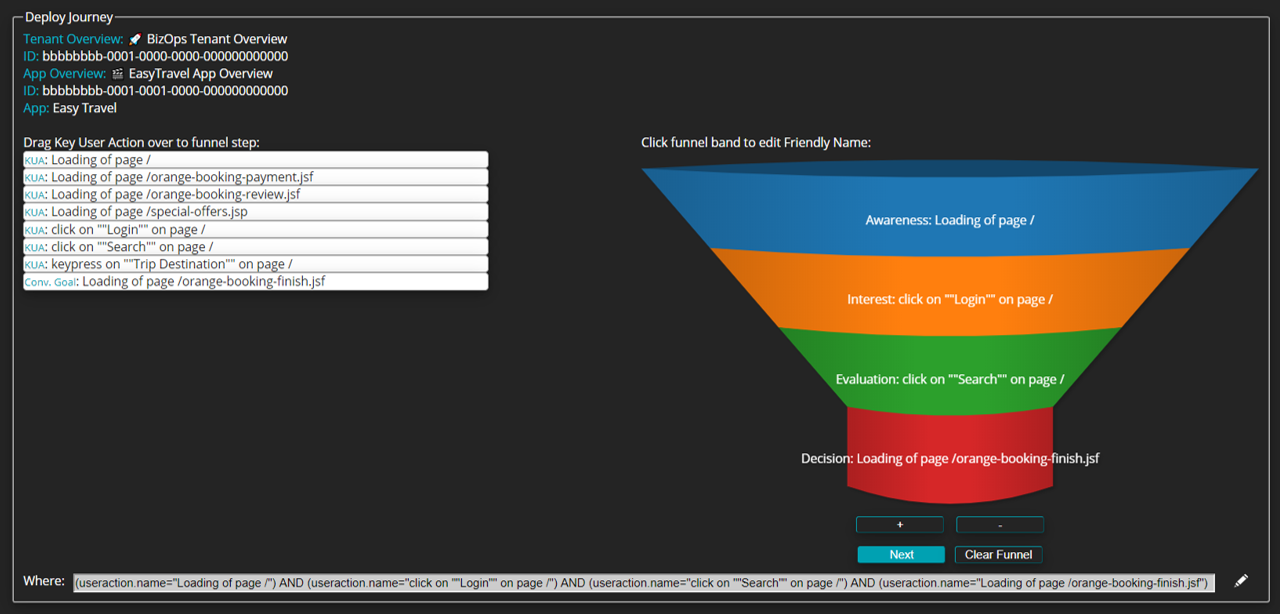
Check back in Dynatrace to see the Book Travel Overview funnel dashboard.
In this lab is split into two sections, the first section generates an API token request URL we can use the fetch data from Dynatrace. The second section uses this URL to import data into Excel. If you already have an API token and URL then jump stright to the part of this lab
Section 1 - Create API Token & Timeseries API Call
Create API Token
First we need to create a API token.
In the Dynatrace dashboard, navigate to the Configuration API: Settings -> Integration -> Dynatrace API
- Click Generate token
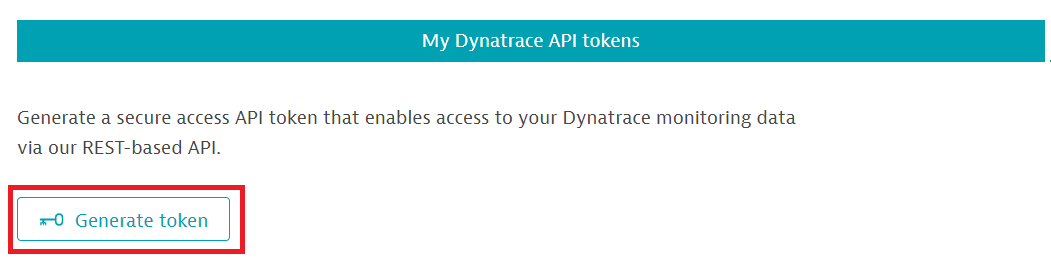
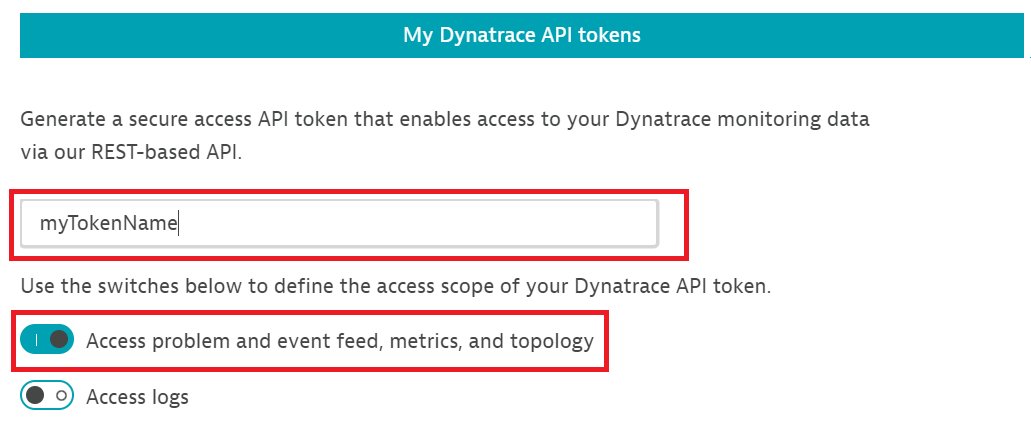
- Enter a name for your token and select the appropriate access switches for the token, then click Generate.
In this lab we will only need Access problem and event feed, metrics and topology
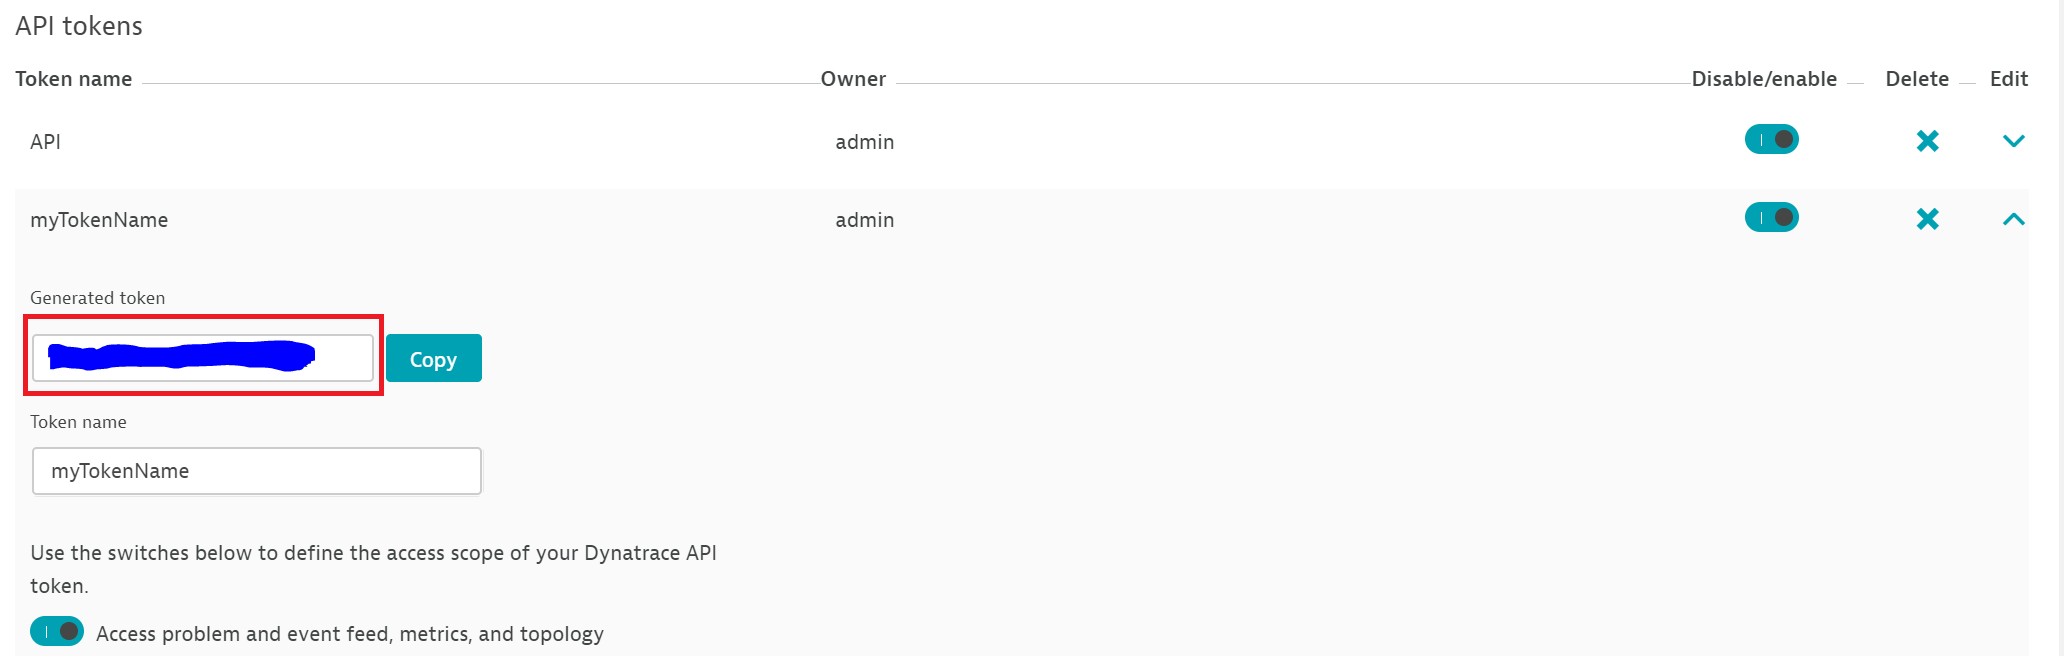
- Click the down arrow (under the edit column) to display your token. Take note of the token for later use.
Access API Explorer
In the Dynatrace dashboard, navigate to the Configuration API: Settings -> Integration -> Dynatrace API
- Click Dynatrace API Explorer
Ensure you are using Environment API v2 (top right corner of the screen)
- Click Authorize
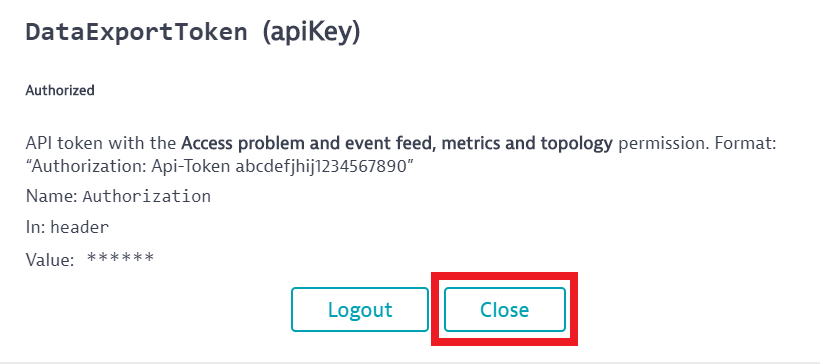
- Enter your API token under the DataExport (apiKey) and click Authorise
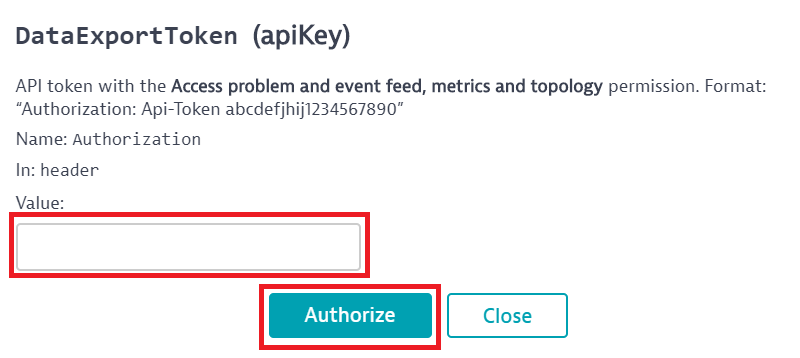
- Click Close
Timeseries API Call
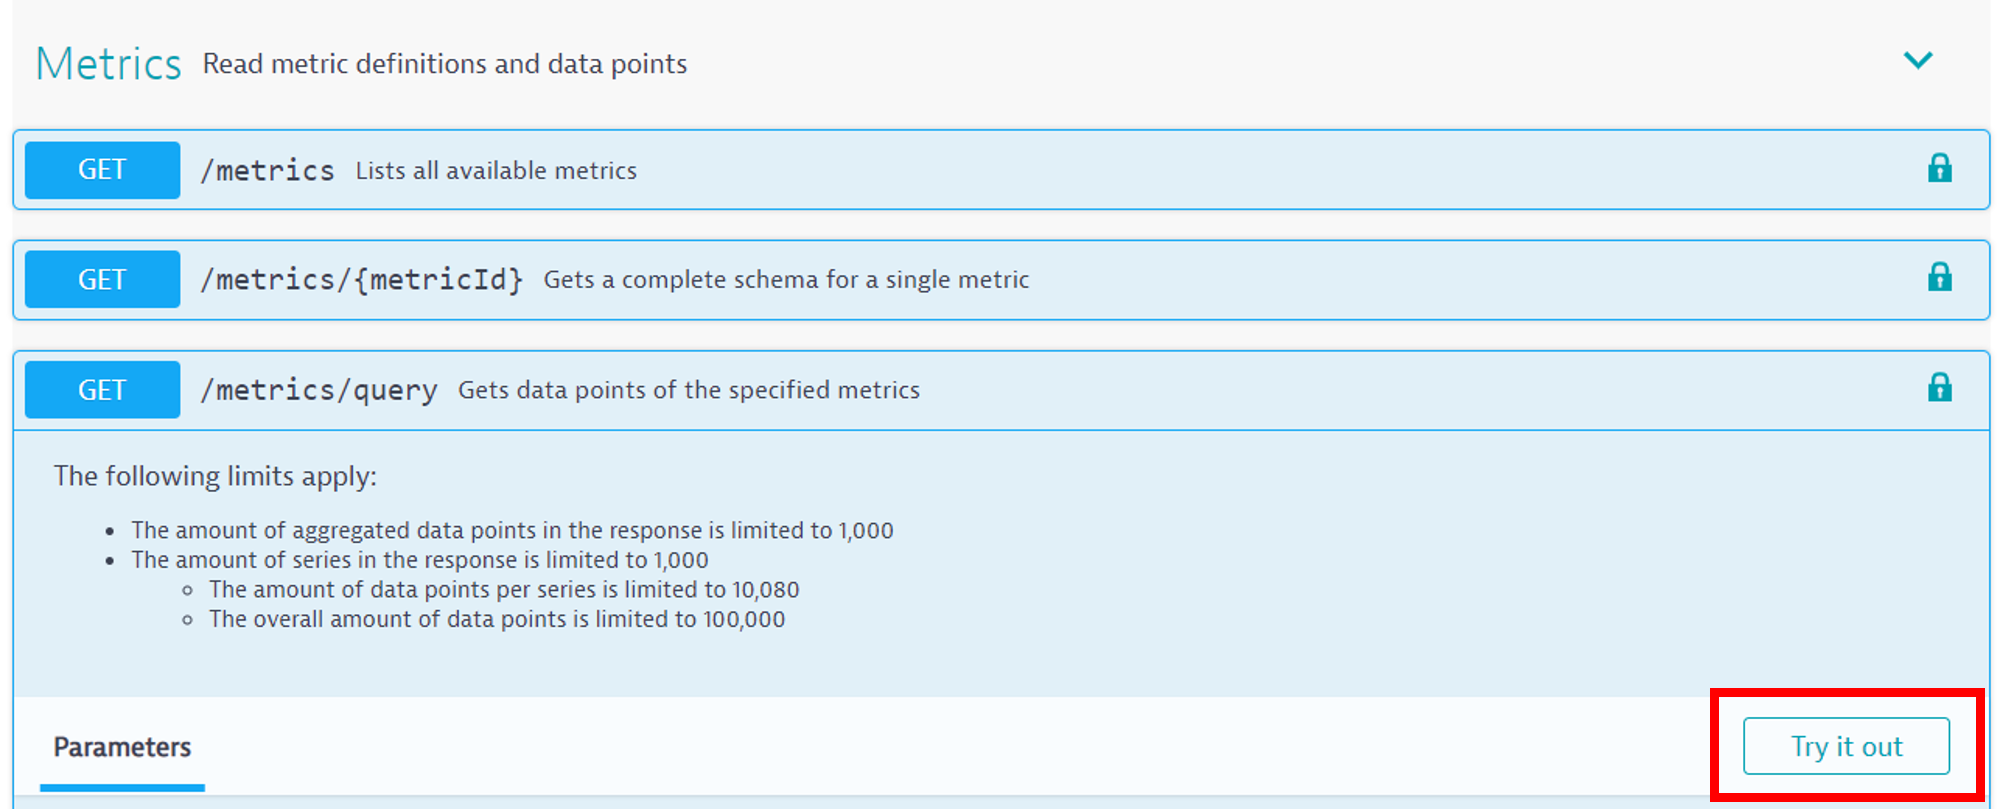
- In the API list select Metrics
- Select GET /metrics/query
- Click Try it out
- Enter the following parameters:
- metricSelector: builtin:apps.web.apdex.userType:filter(eq(User type,Real users)):names
- resolution: 5m
- from: now-4h
- Change Response content type to text/csv; header=present; charset=utf-8
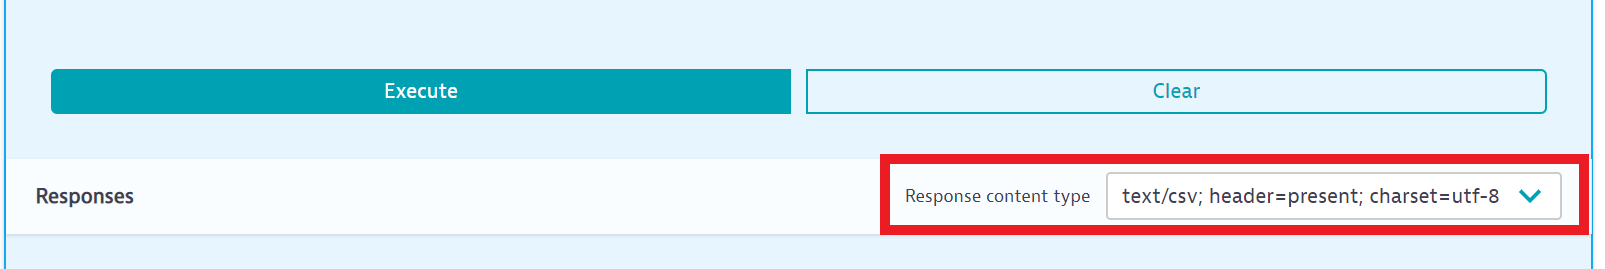
- Click Execute. If successful the result should be shown looking something like this:
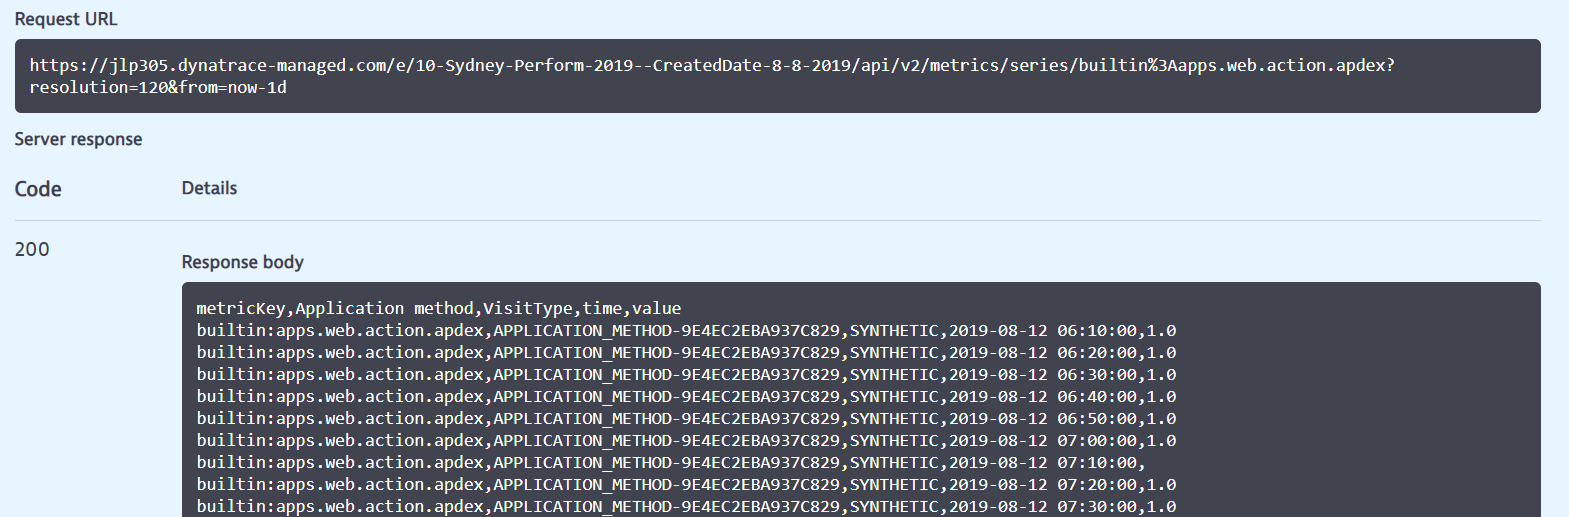
Copy the Request URL for use in the next section.
Section 2 - Create API Token & Timeseries API Call
- Open Excel and create a new workbook.
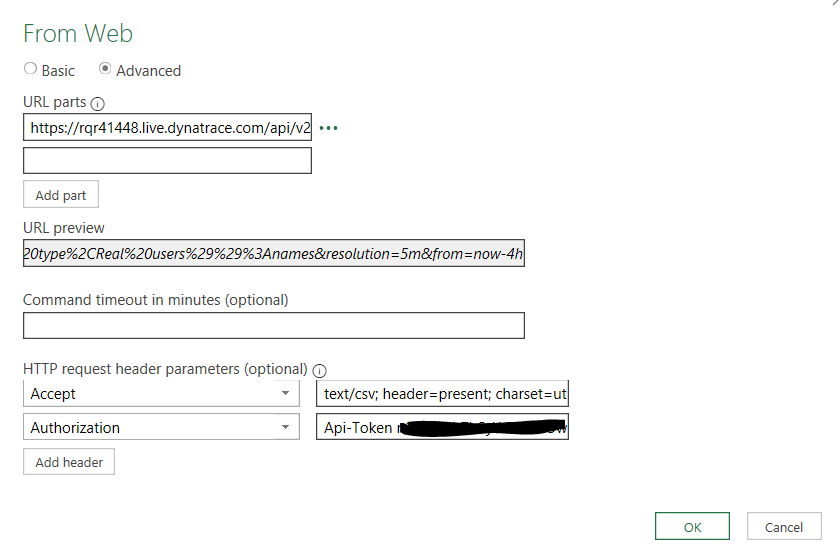
- Select: Data > From Web
- Select Advanced
- Enter your Request URL in URL Parts
- Add the following HTTP request header parameter then click OK and Connect Accept text/csv; header=present; charset=utf-8 Authorization Api-Token
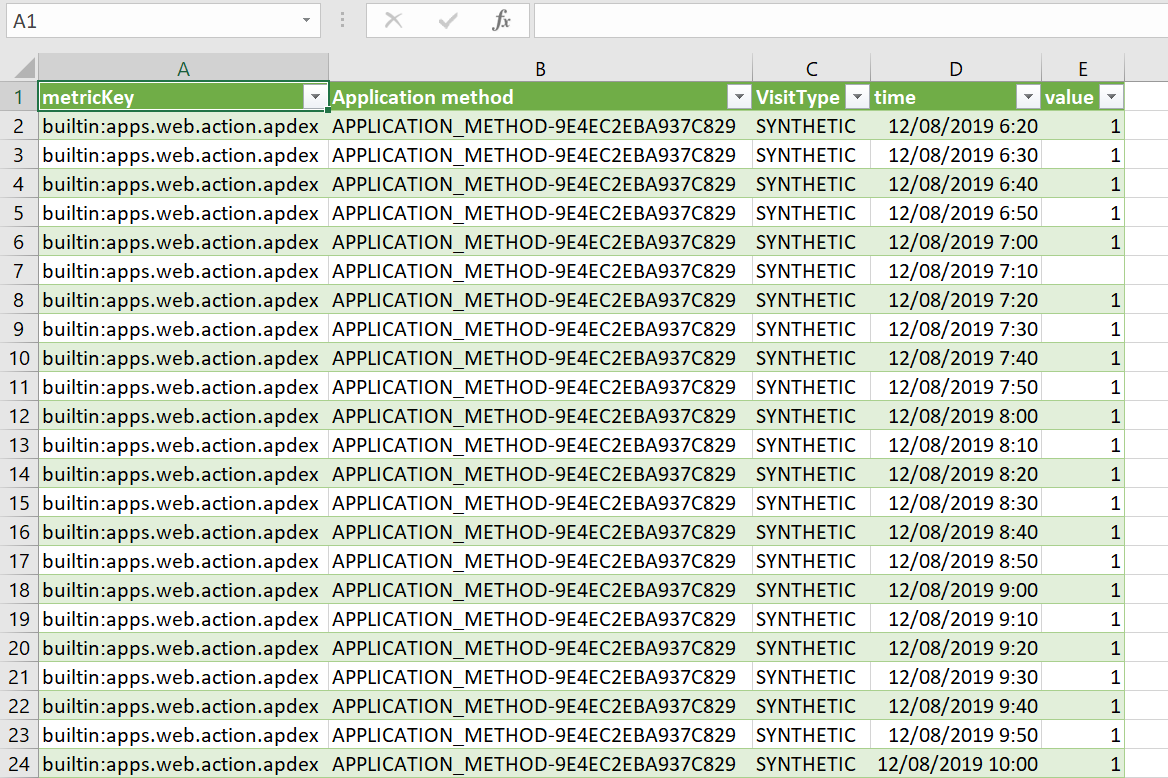
- Click Load
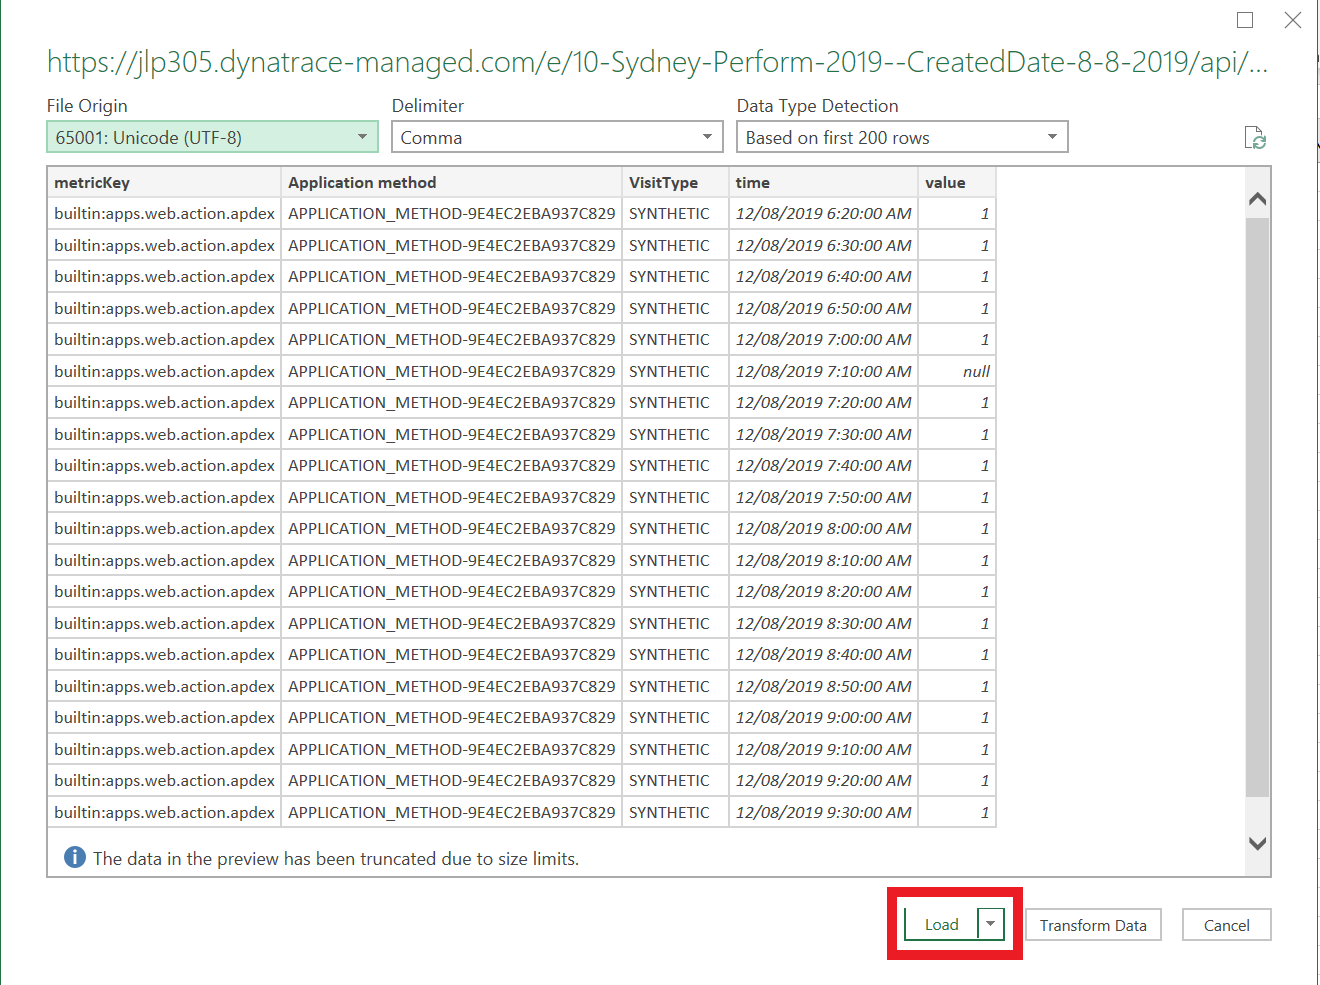
- You data sould be imported
We hope you enjoyed this lab and found it useful. We would love your feedback!