This section contains the simple steps required to get started with Redhat Openshift.
What You'll Learn
- Setting up Openshift
- Deploy Dynatrace Operator
- Discover and Explore Dynatrace
Choosing your deployment approach
There are various ways to setting up a free Red Hat Openshift trial. You can also find other DIY apporaches on Github via Terraform / Ansible. The various approaches to creating the Openshift clusters are provided as one-click options with the Redhat Hybrid Cloud Console
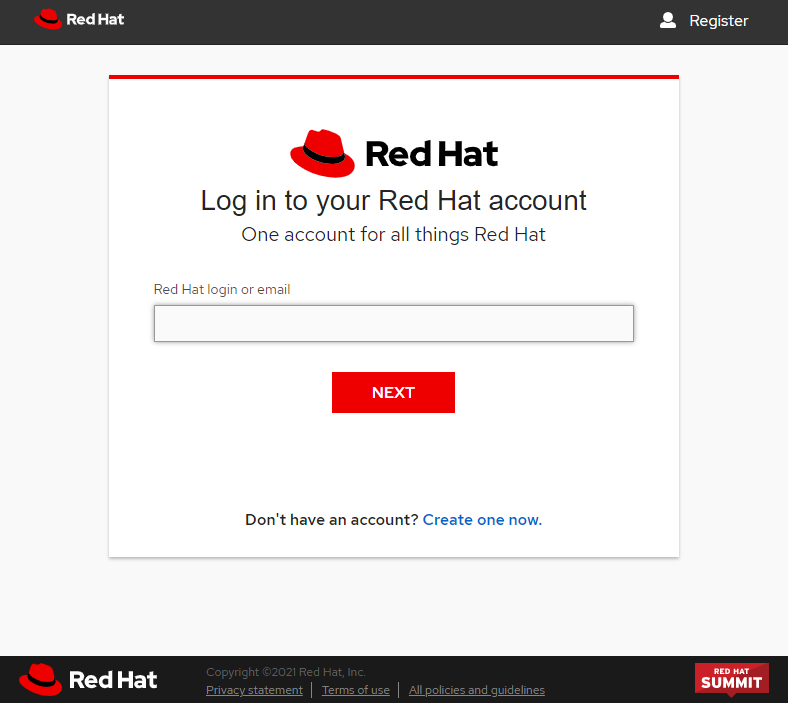
- Go to the Redhat Hybrid Cloud Console.
- You can login with an existing account or create a new account
- Redhat Openshift could be created on the Cloud as a Managed service (eg. AWS, Azure, IBM Cloud) but also as run-it-yourself options
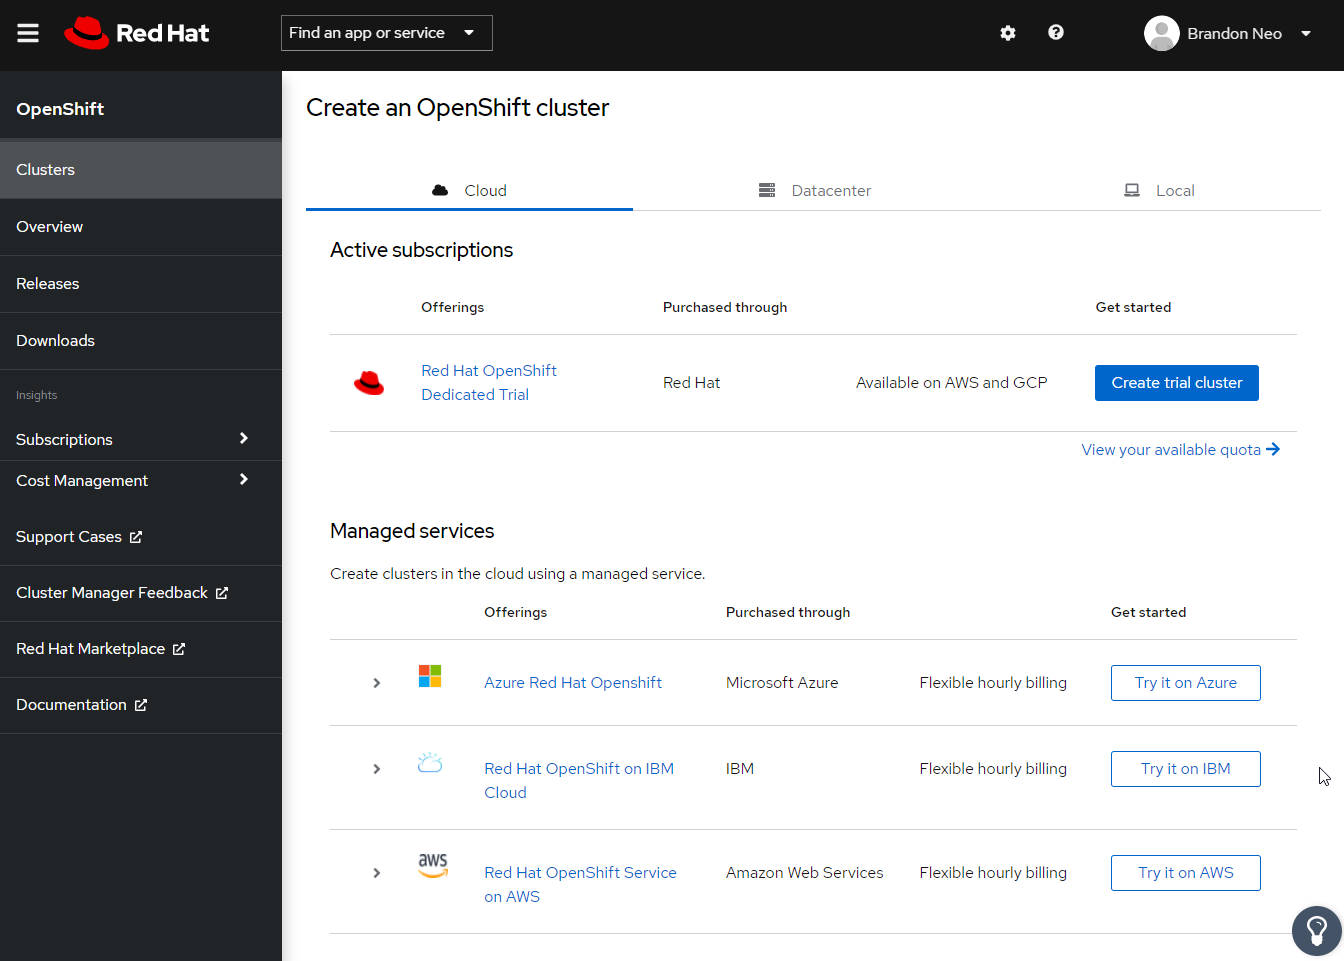
- For the purposes on this lab, we will be running the lab with Red Hat Dedicated Trial
We will now log into the Cluster and deploy Dynatrace OneAgent. Dynatrace supports various Openshift deployment approaches with the various rollouts. There are different ways to activate Dynatrace on OpenShift and each way has its own advantages. We recommend these deployment strategies in terms of feature completeness and lack of constraints. Our documentation link contains the various approaches.
We will be following the steps based on our following documentation
Deploy the Dynatrace Operator via OperatorHub
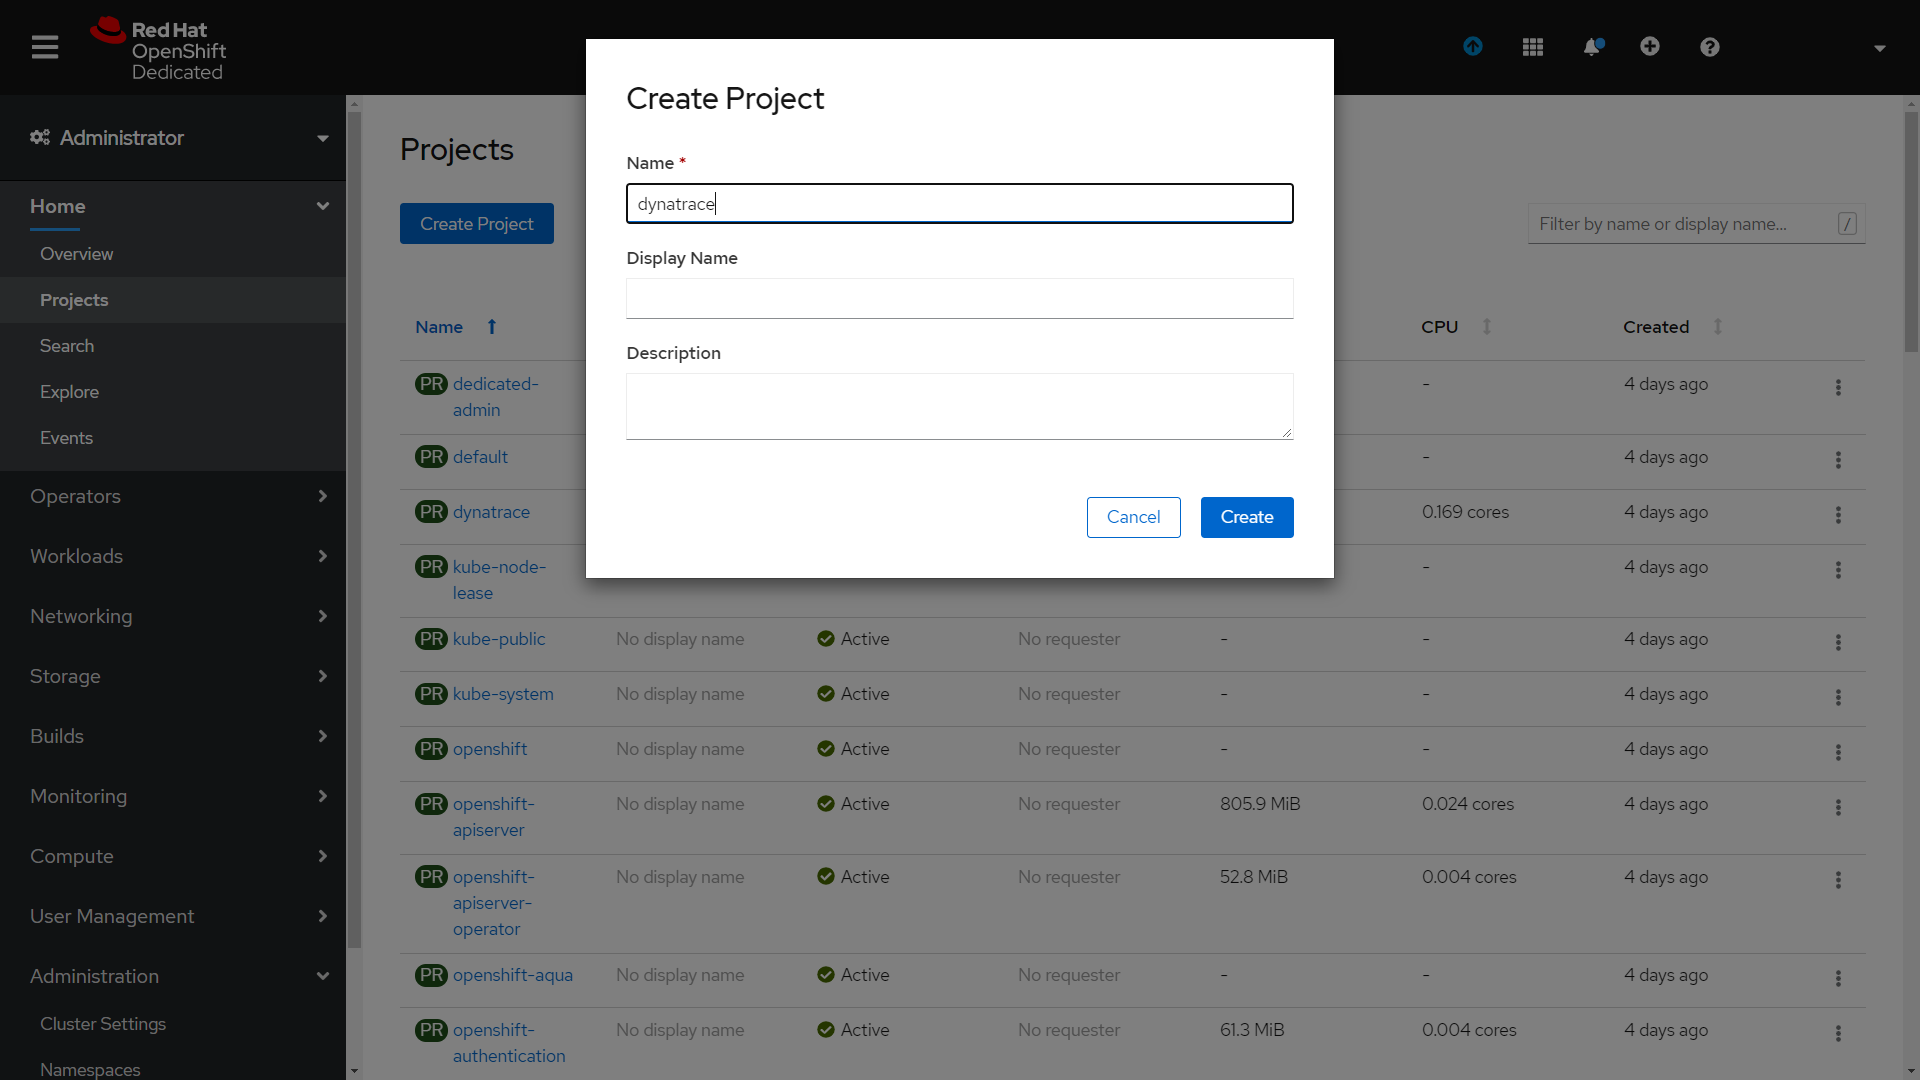
- Create a new project and deploy the operator.
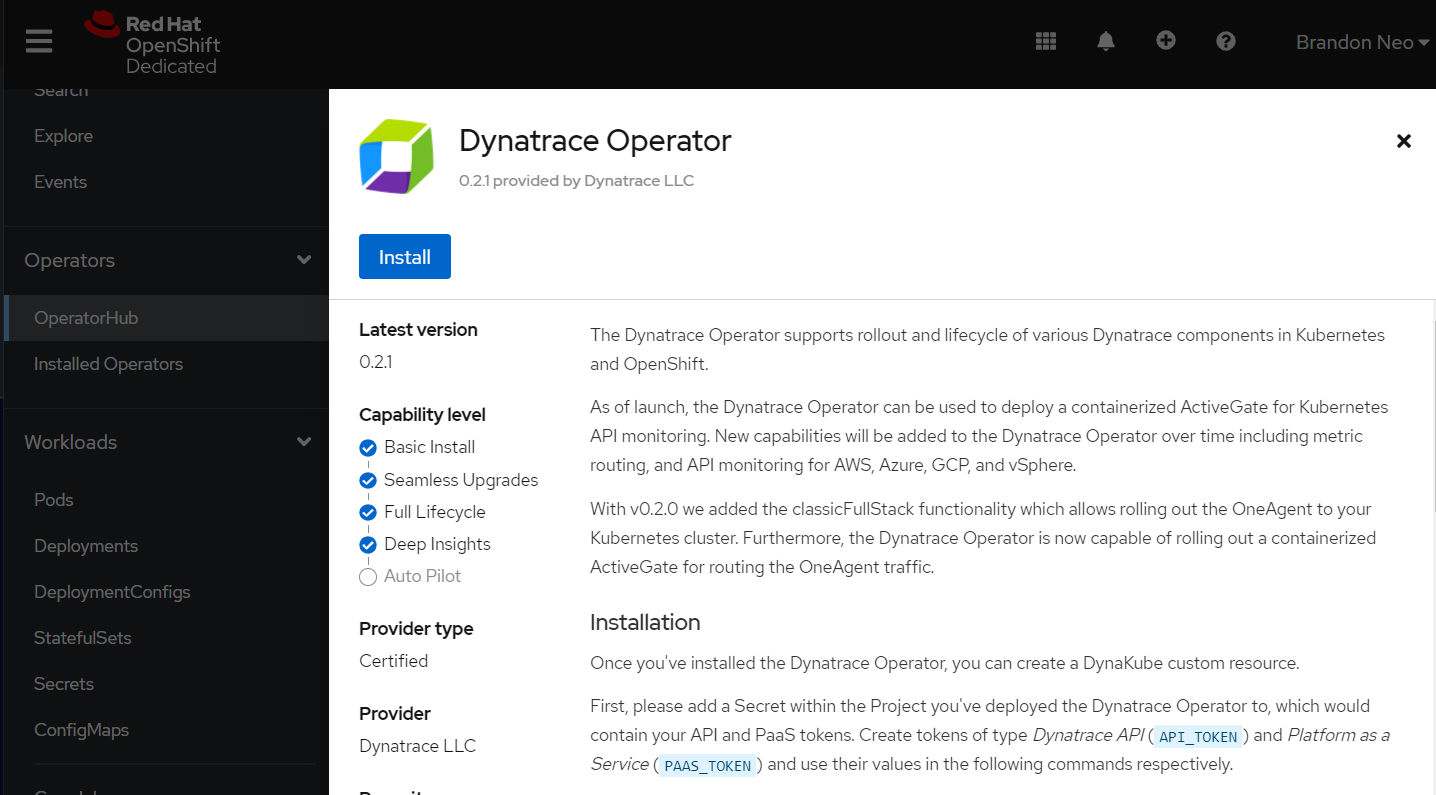
- Within the Openshift dashboard, go to Operators > OperatorHub
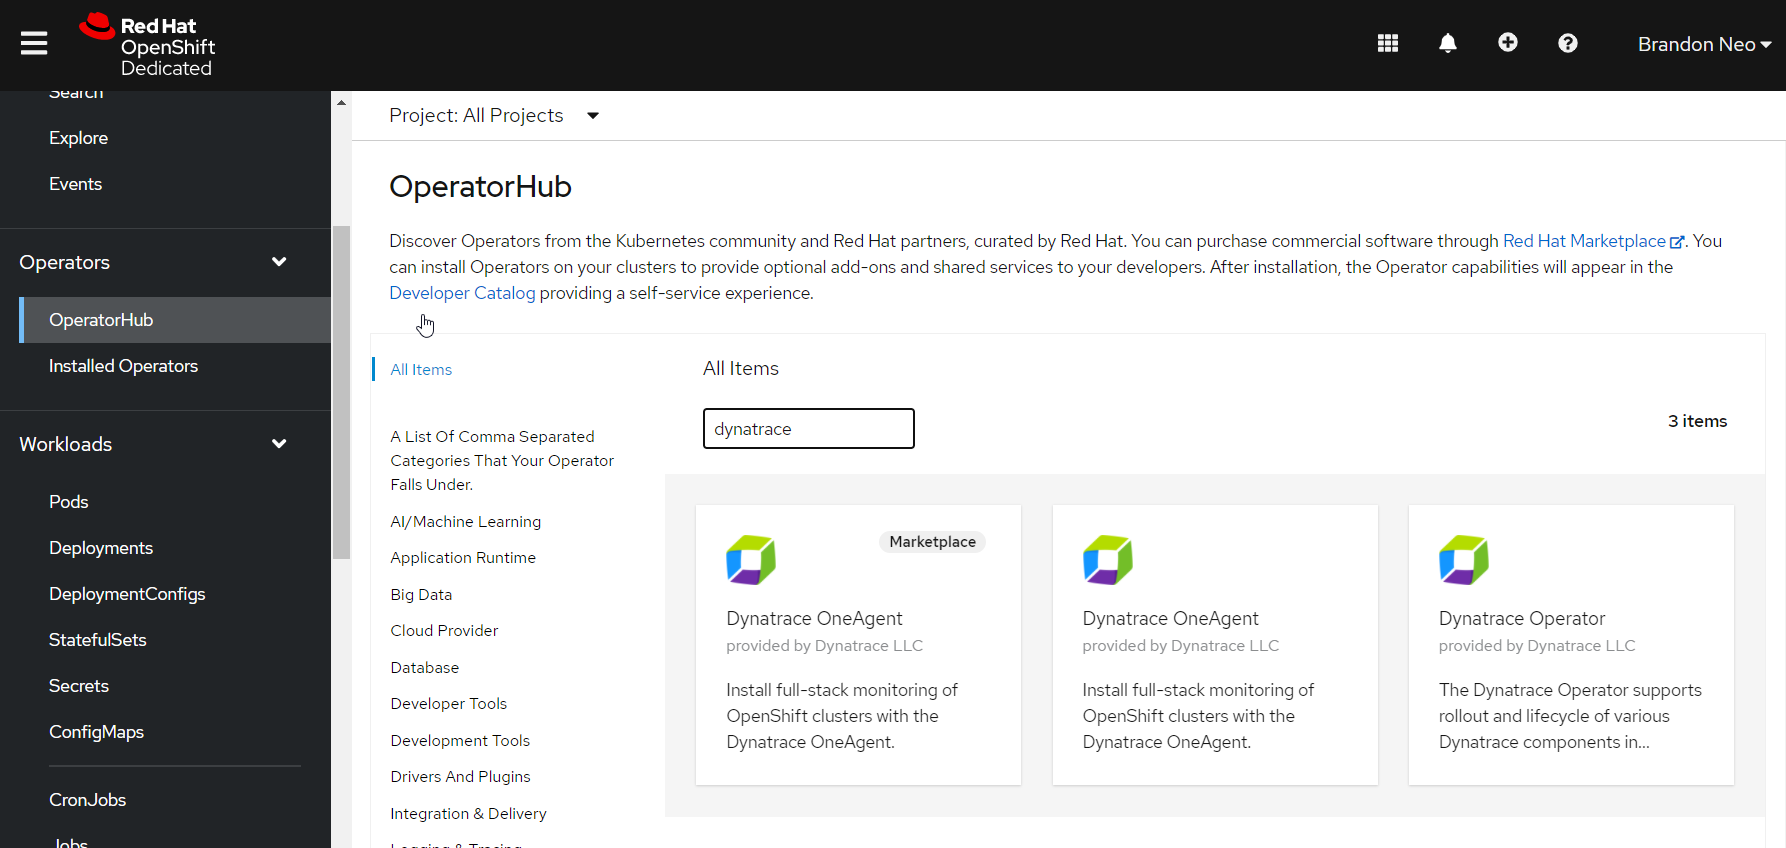
- We will select the Dynatrace Operator and click on Install
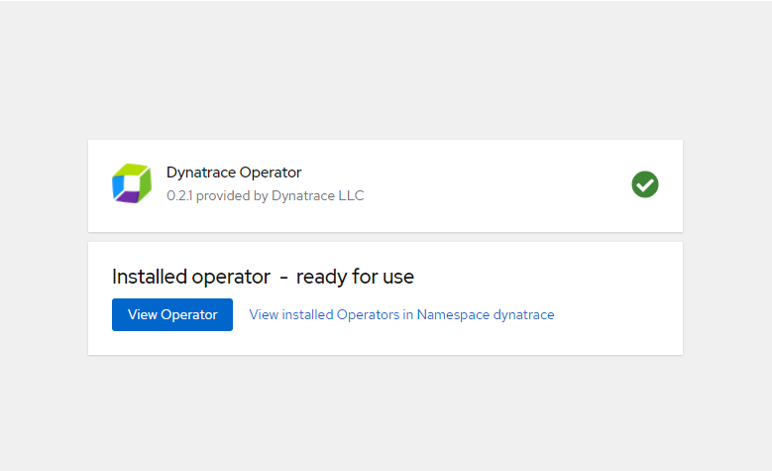
- Once installed, click on View Operator.
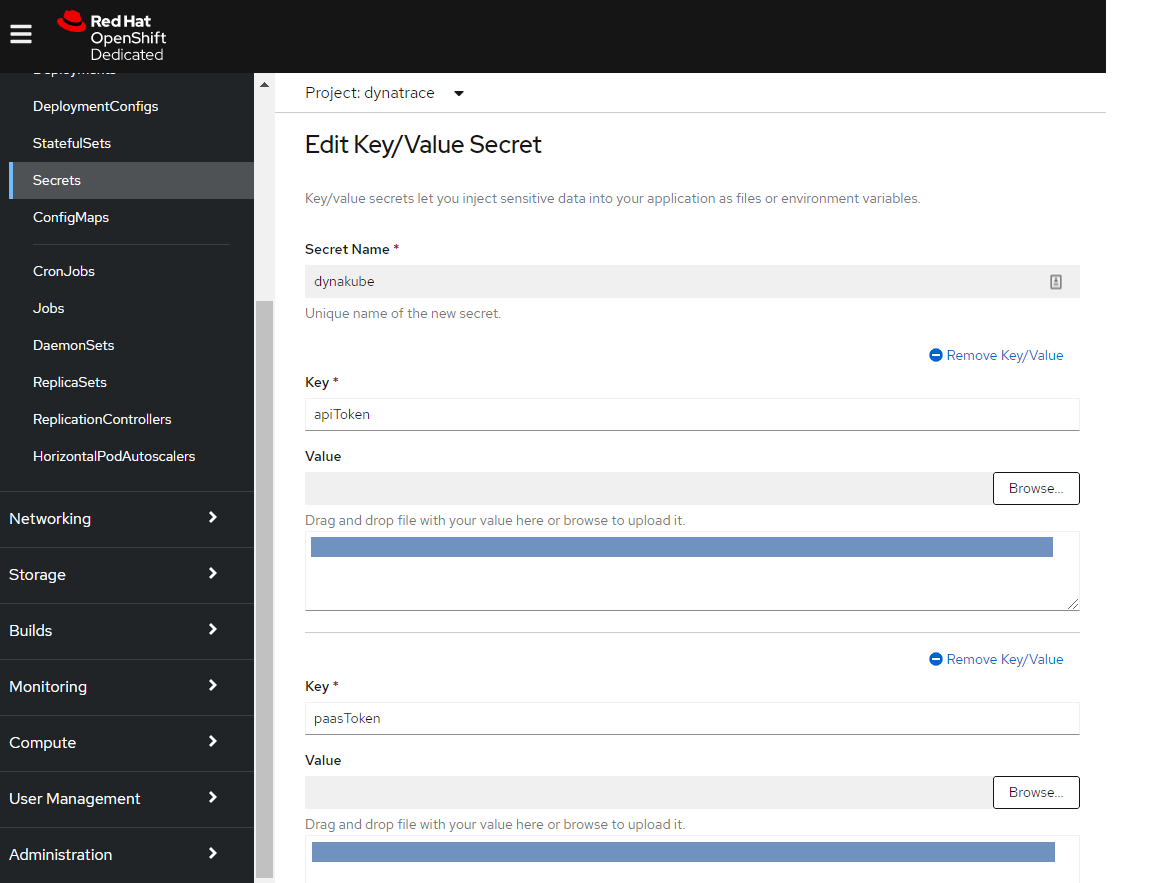
Create a Key/Value secret
To create an instance the Operator, we will need first need to create key/value secret.
Within Dynatrace, use the following steps to get your apiToken and paasToken.
- Select Dynatrace Hub from the navigation menu.
- Select Openshift
- Select Monitor Openshift button from the bottom right.
Within the Monitor Kubernetes / Openshift page, follow these steps below:
- Enter a Name for the connection Eg.
openshift - Click on Create tokens to create PaaS and API tokens with appropriate permissions
- Copy the tokens and use them in Openshift
- Back in Openshift, go to Workload > Secrets
- Name the key dynakube
- Click on Add Key/Value and paste the token value from Dynatrace
- Click on Save
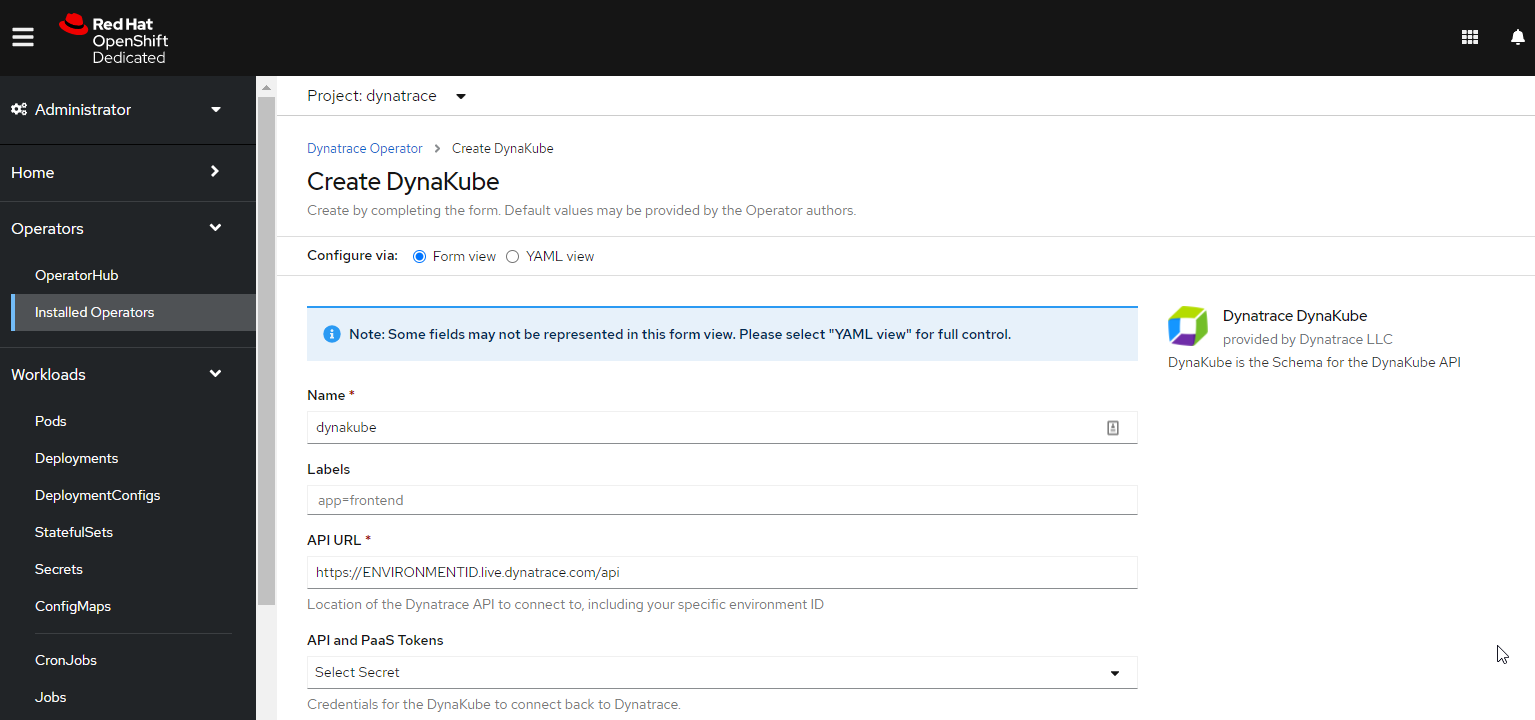
Create an instance of Dynatrace Dynakube
Dynatrace Dynakube is the schema which is used for Dynatrace Operator.
- In Openshift, go to Operators > Installed Operators and select Dynatrace Operator
- Click on Create Instance
- Fill up the API URL based on your Dynatrace environment
- Use your newly created Dynakube secret under API and PaaS Tokens
- Use the default values and click on Create at the bottom
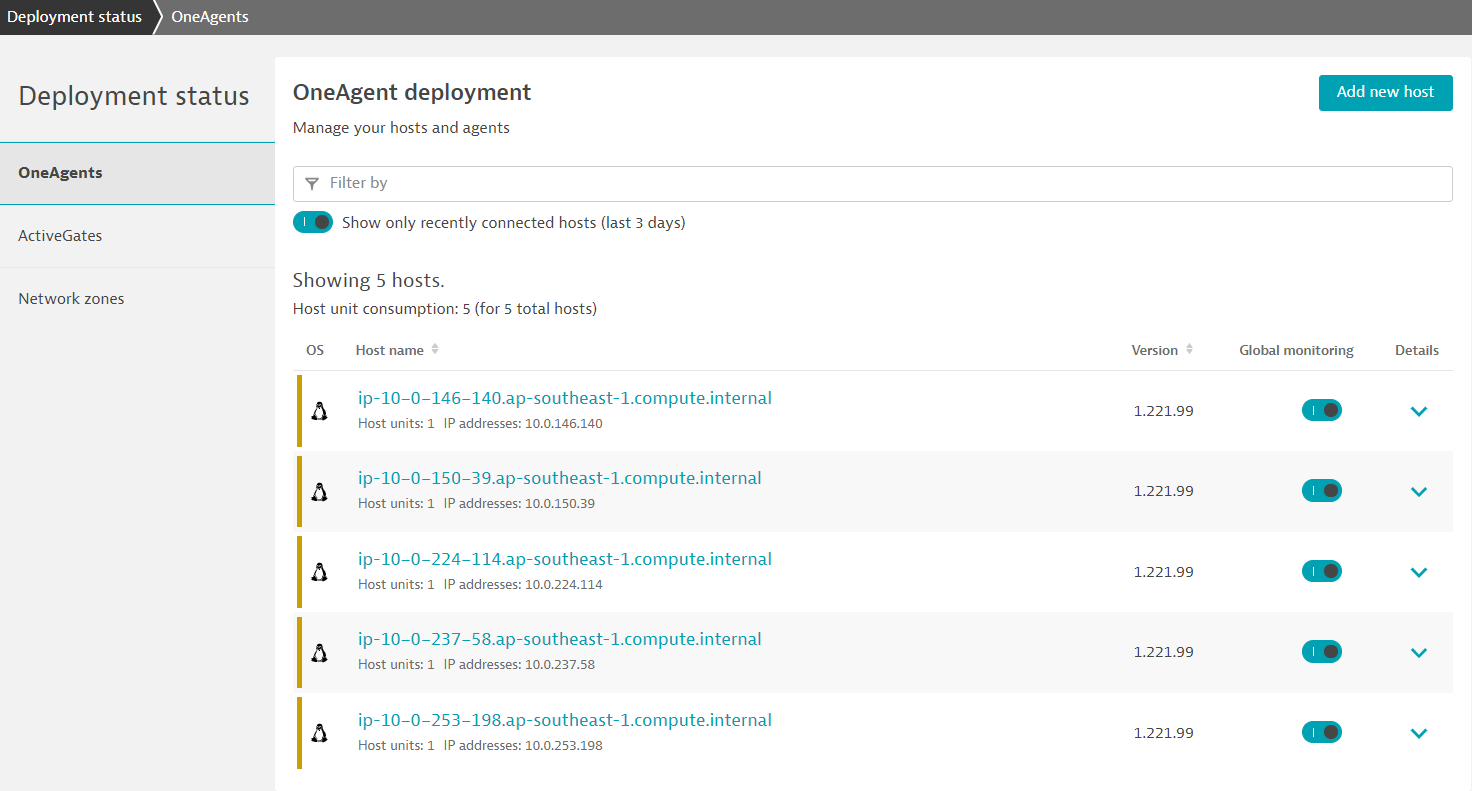
Validate the installation in Deployment status
Click on Show deployment status to check the status of the connected host.
You should be able to see a connected Openshift nodes as per the image below.
With your setup done, explore what Dynatrace monitors automatically.
- On the left menu, filter for Dashboards to view the preset Kubernetes dashboards
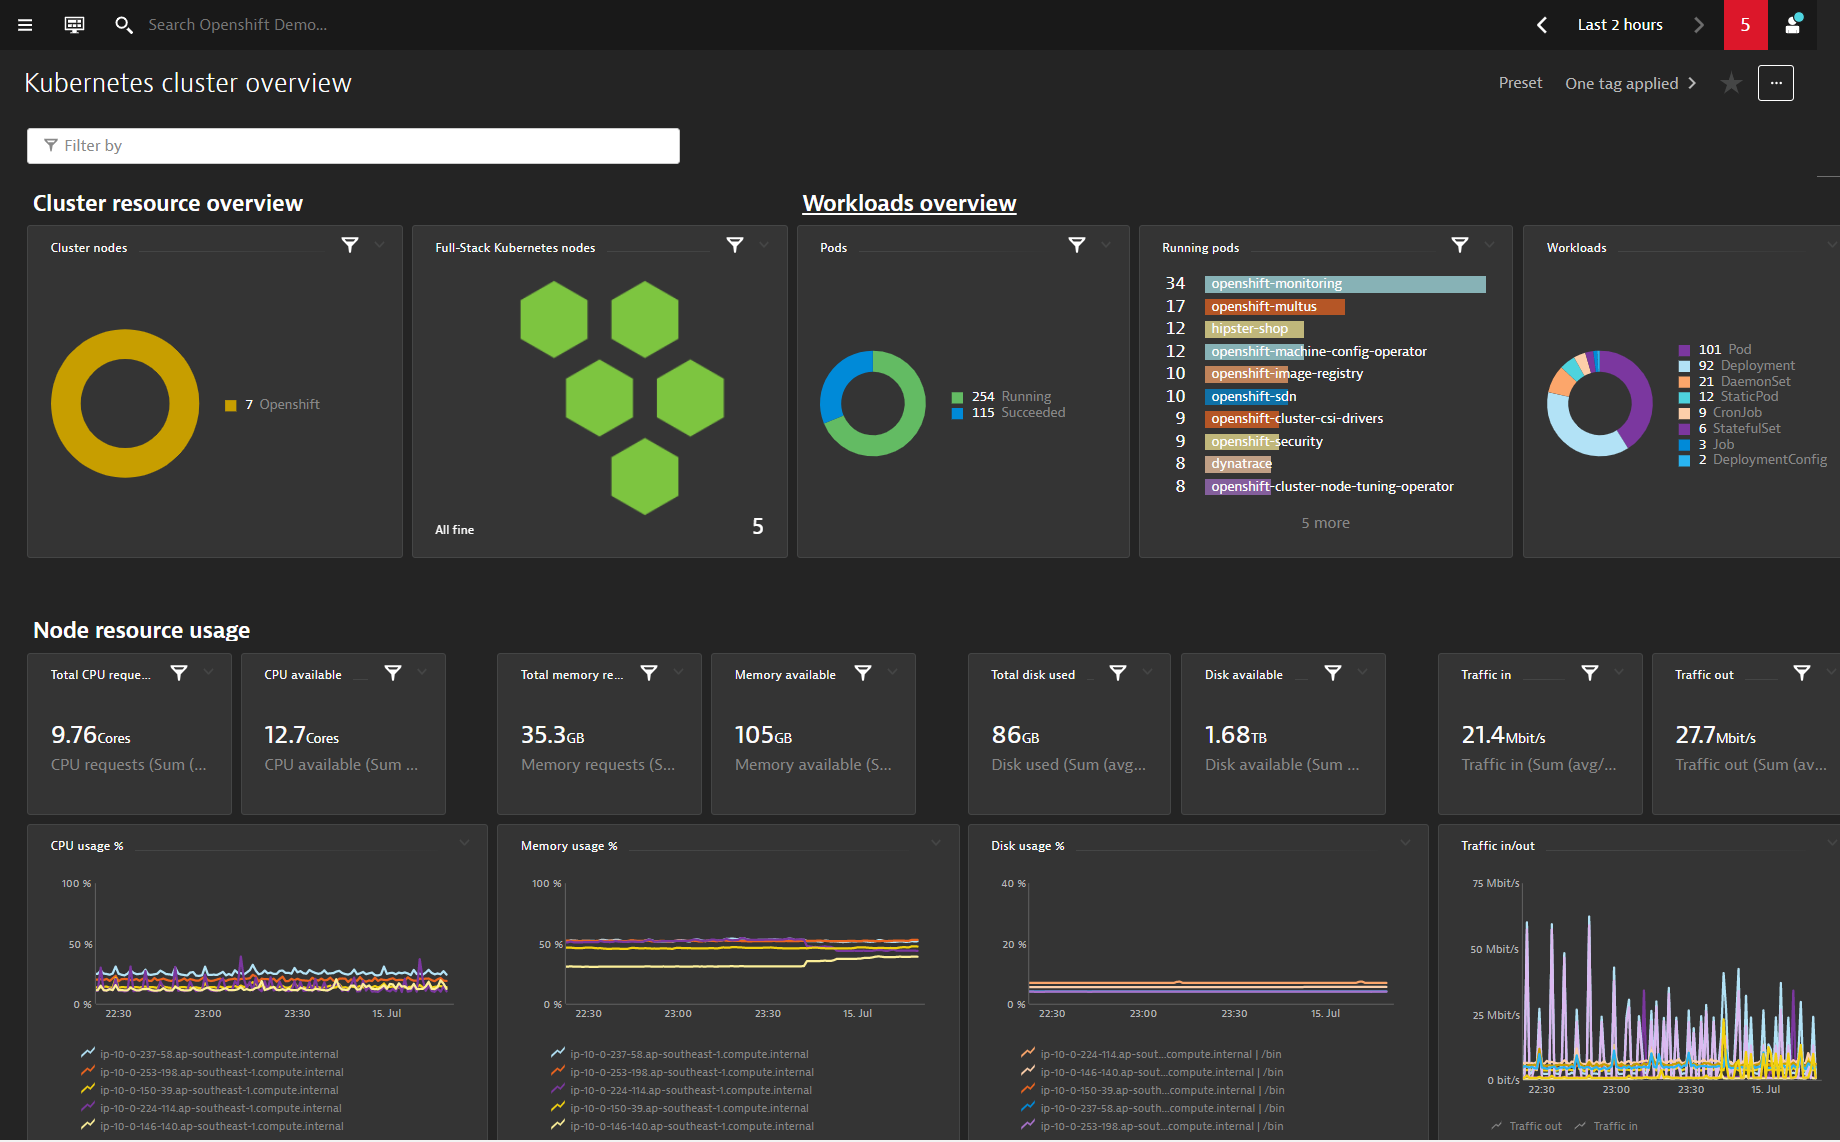
Exploring Kubernetes View
Explore the various functionalities within the Kubernetes View such as Cluster Utilization, Cluster Workloads, K8S Events
- On the left menu, filter for Kubernetes to view the Kubernetes dashboards
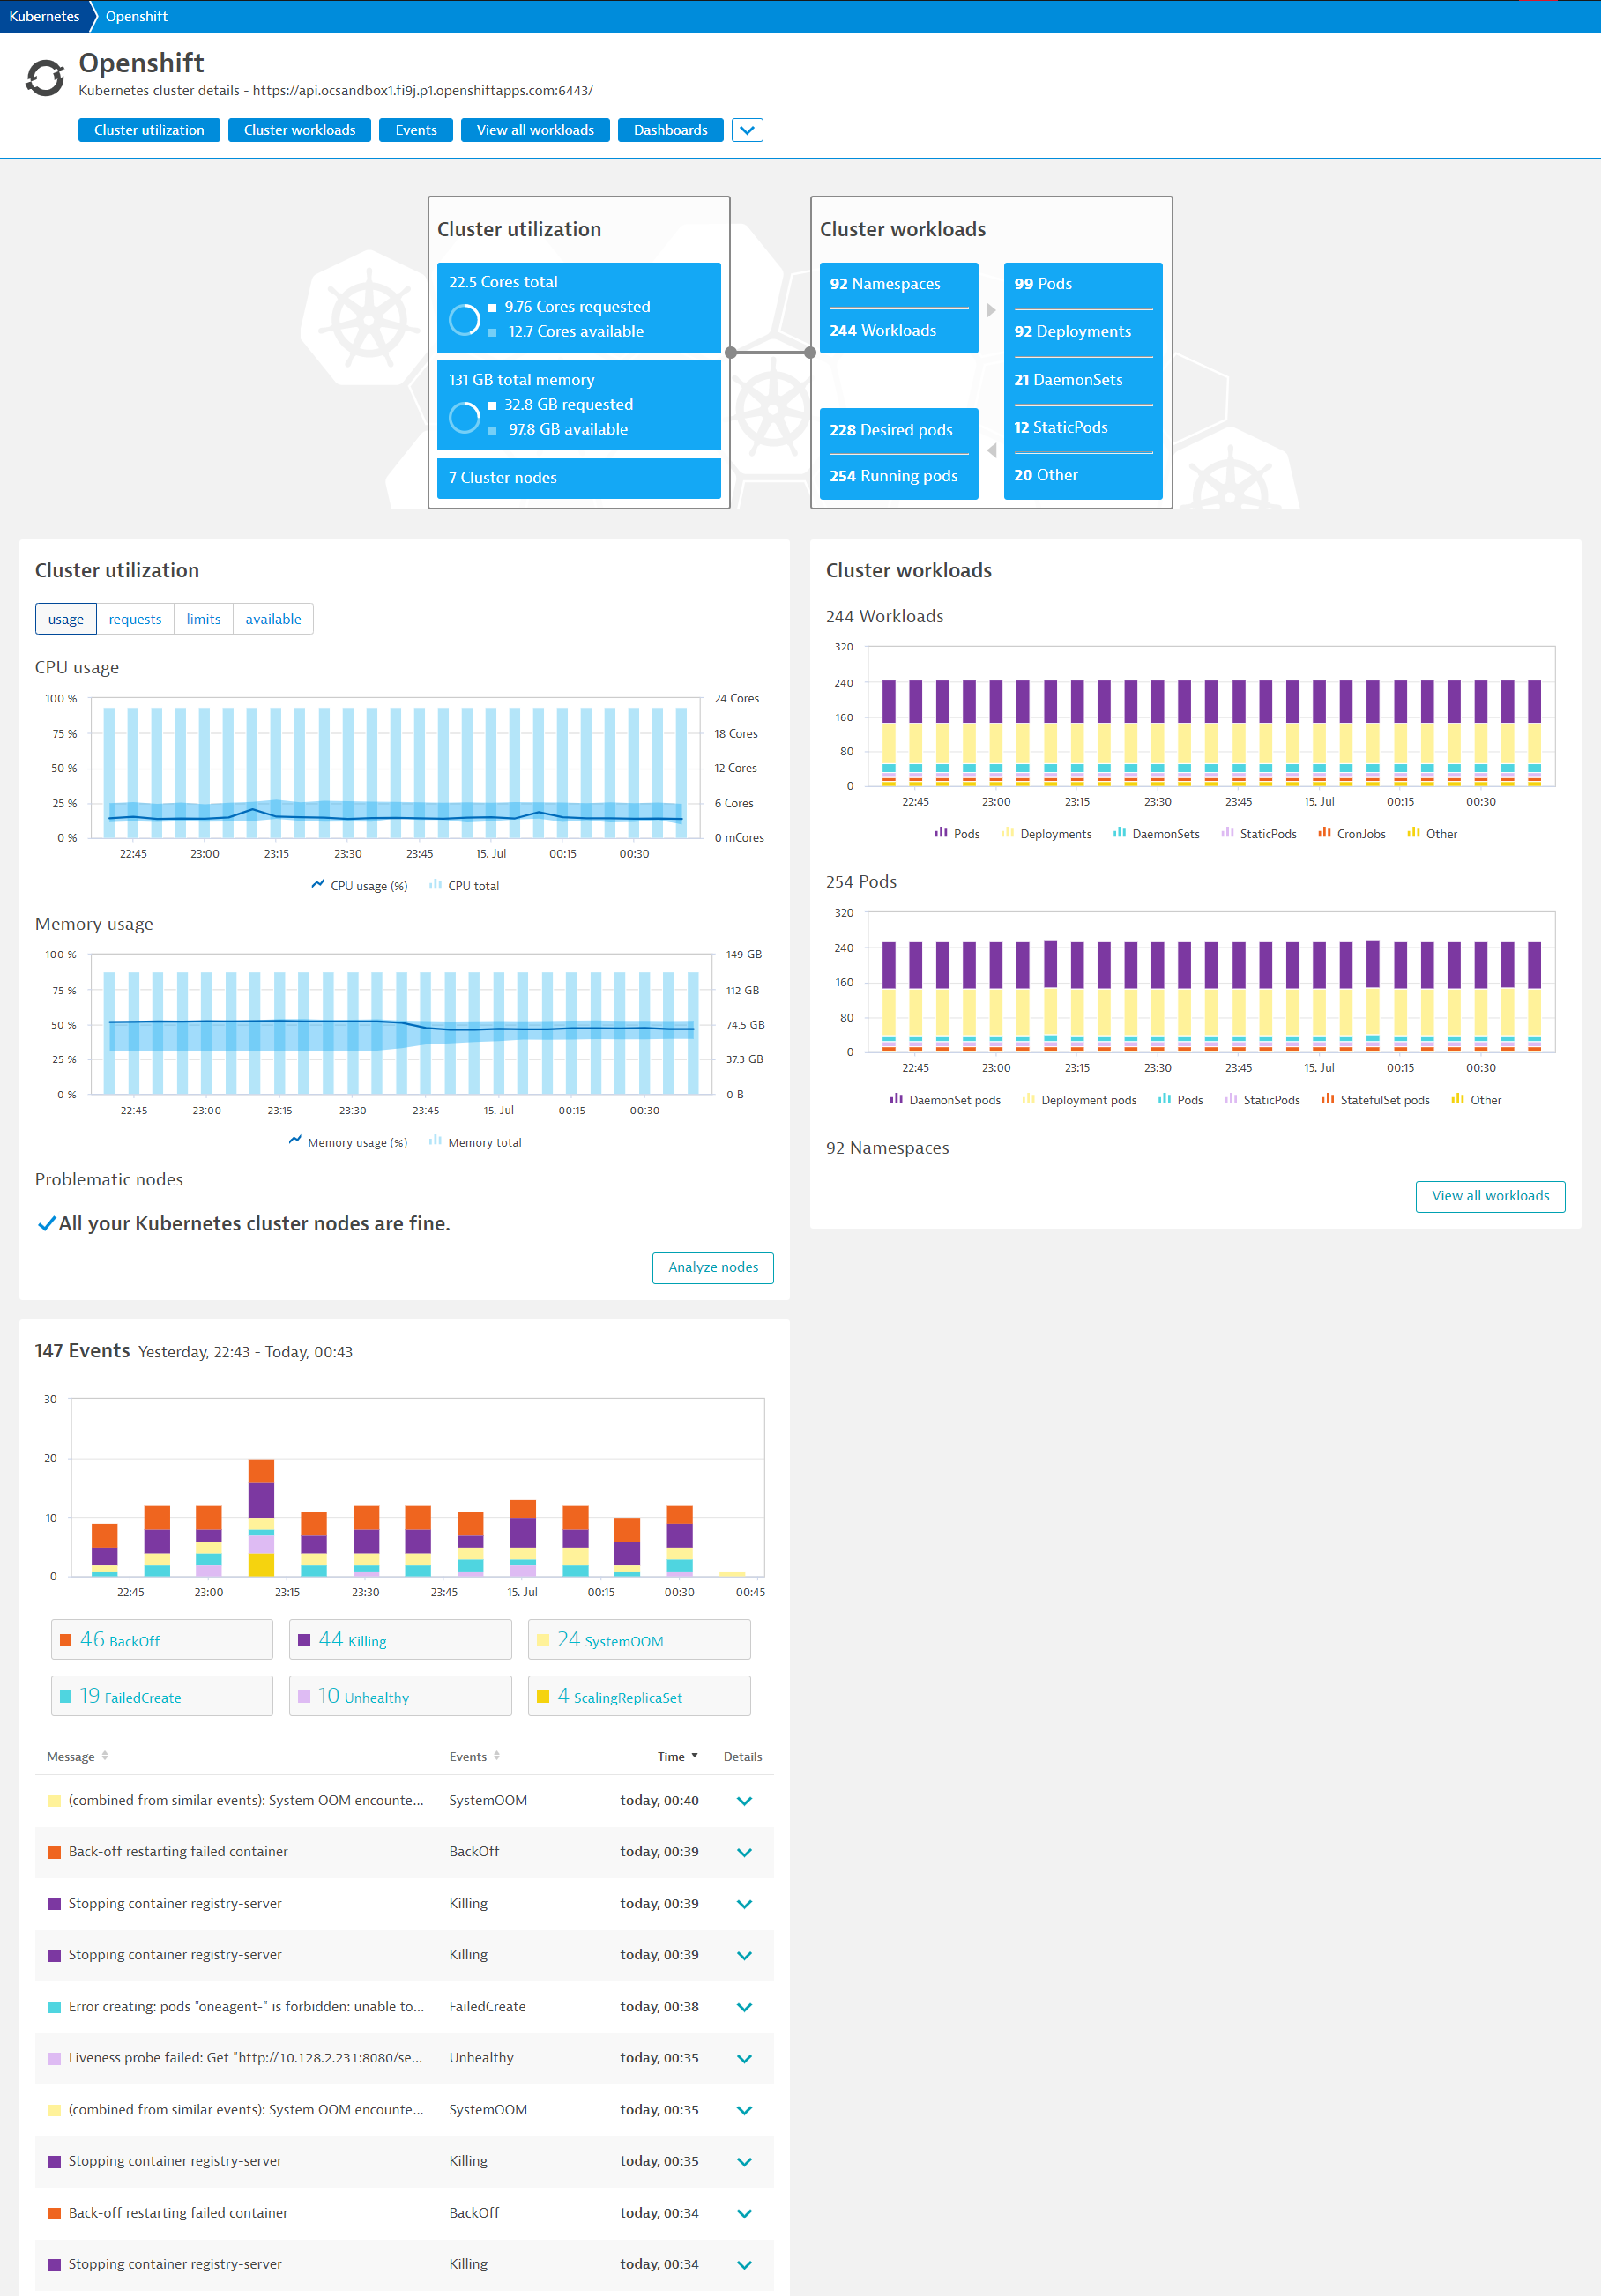
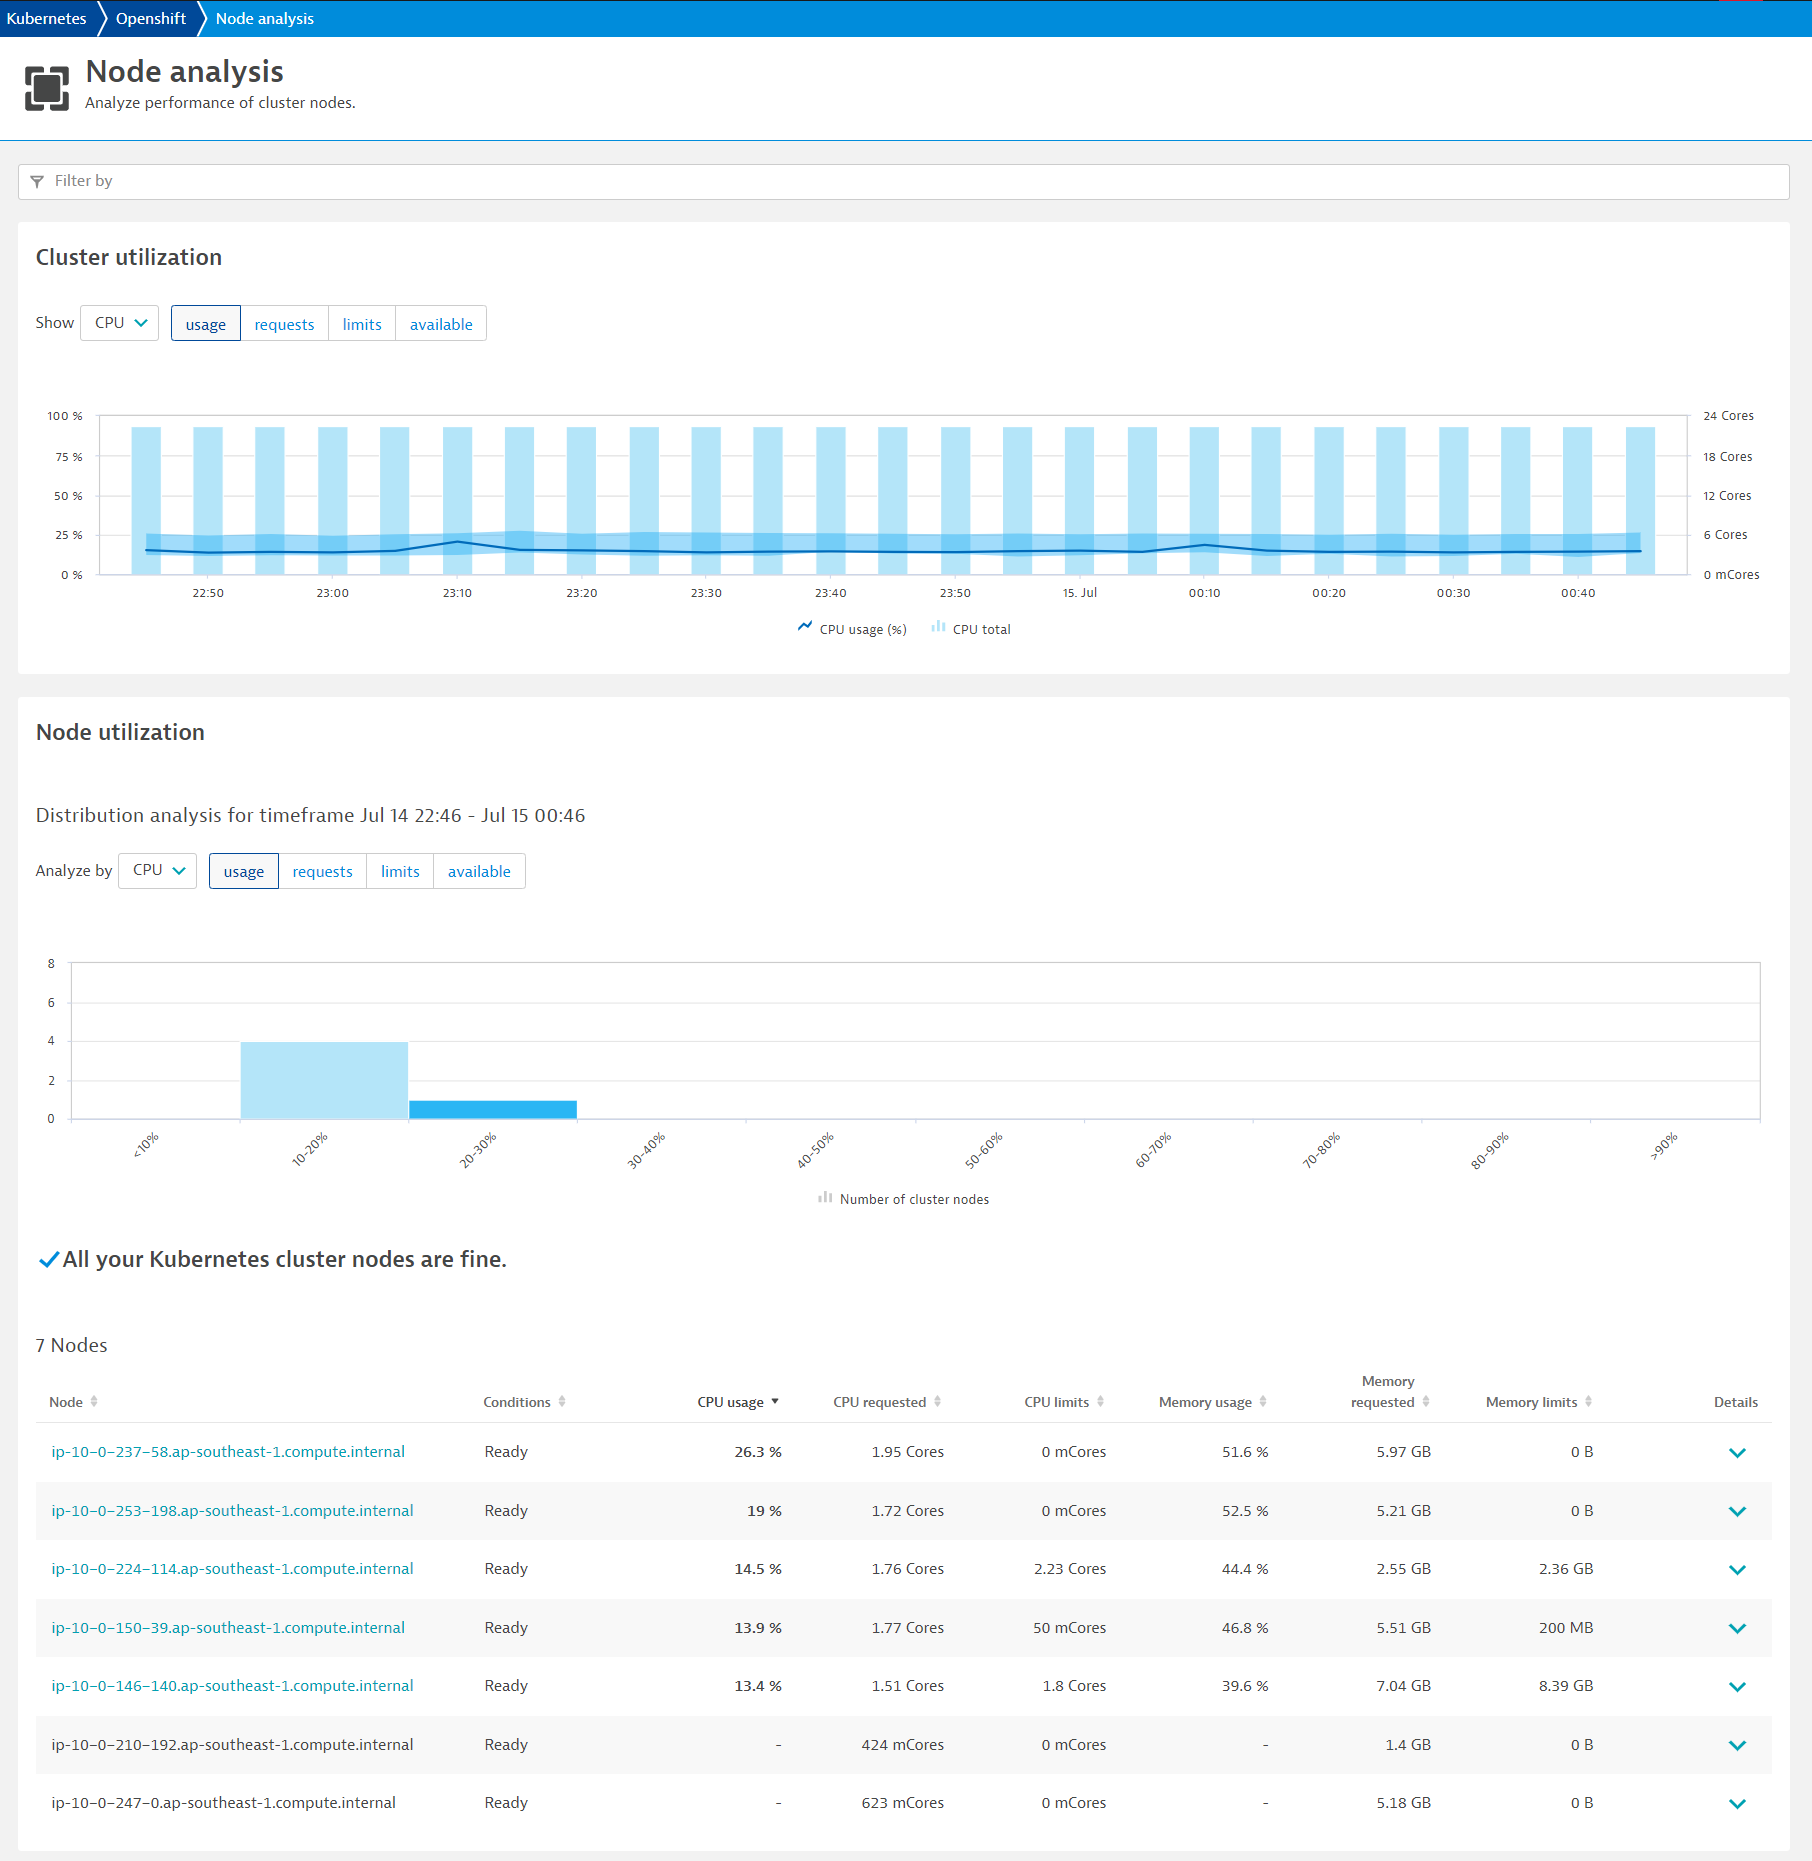
Analyze the Kubernetes Cluster utilization
- Mouseover and note the CPU and Memory usage with the Min / Max
- Click on Analyze Nodes to drill deeper into each node
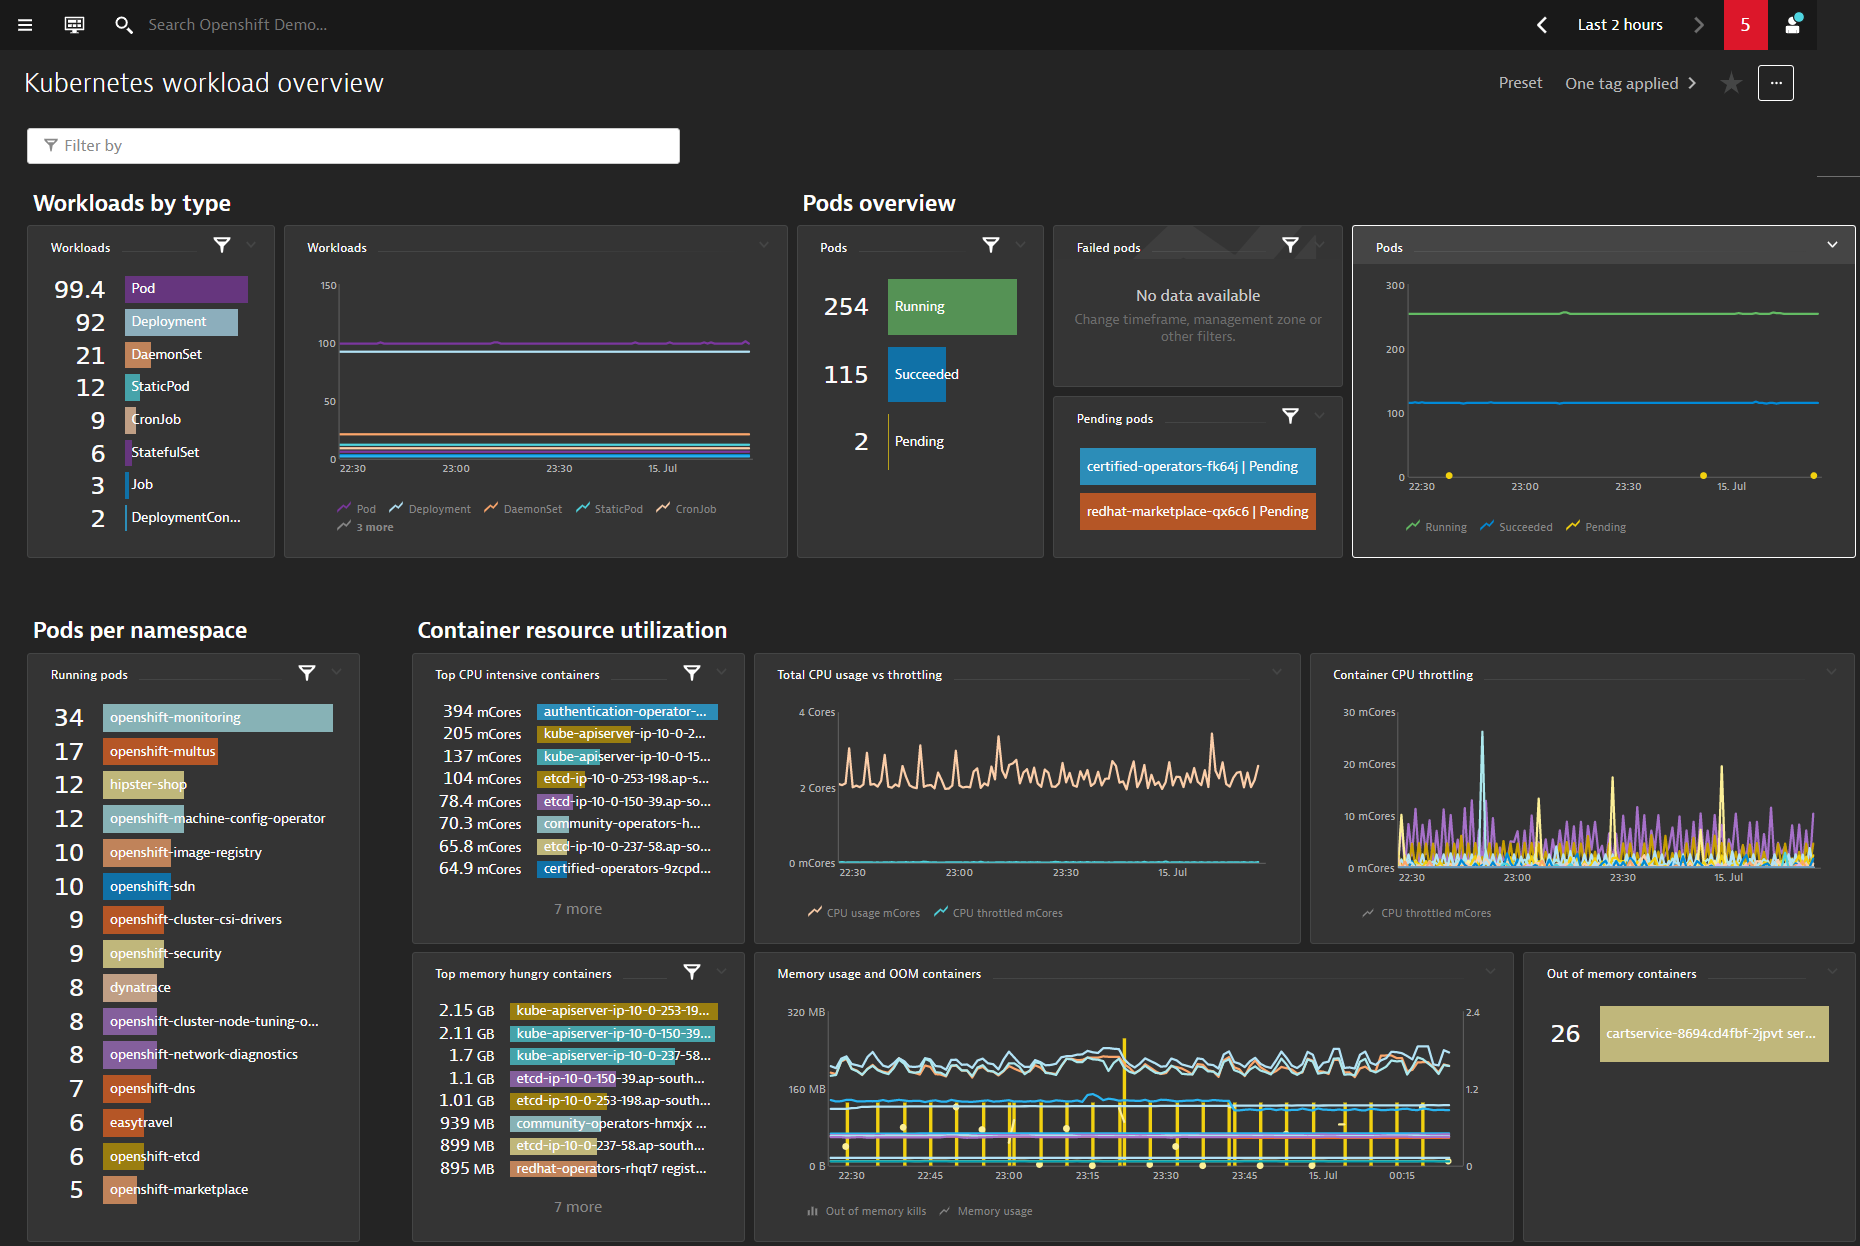
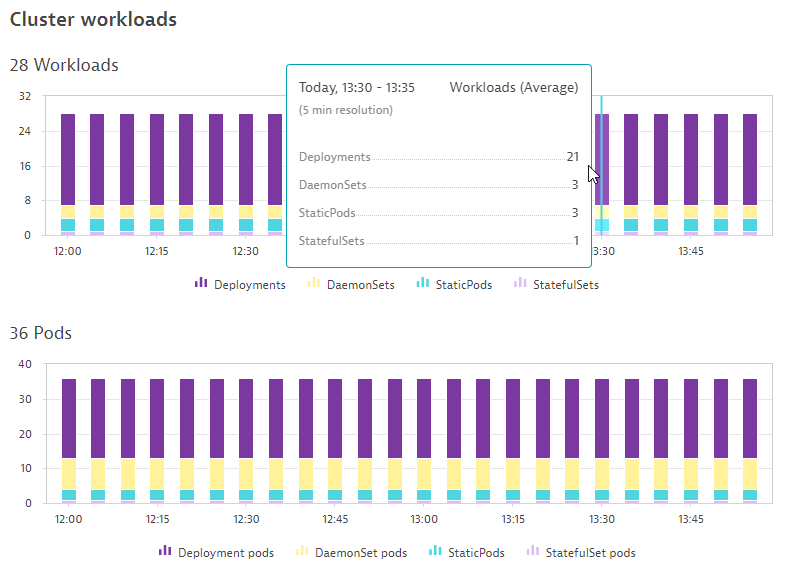
Analyze the Kubernetes Cluster Workloads
- Notice the Workloads and Pods running spilt between Kubernetes controllers
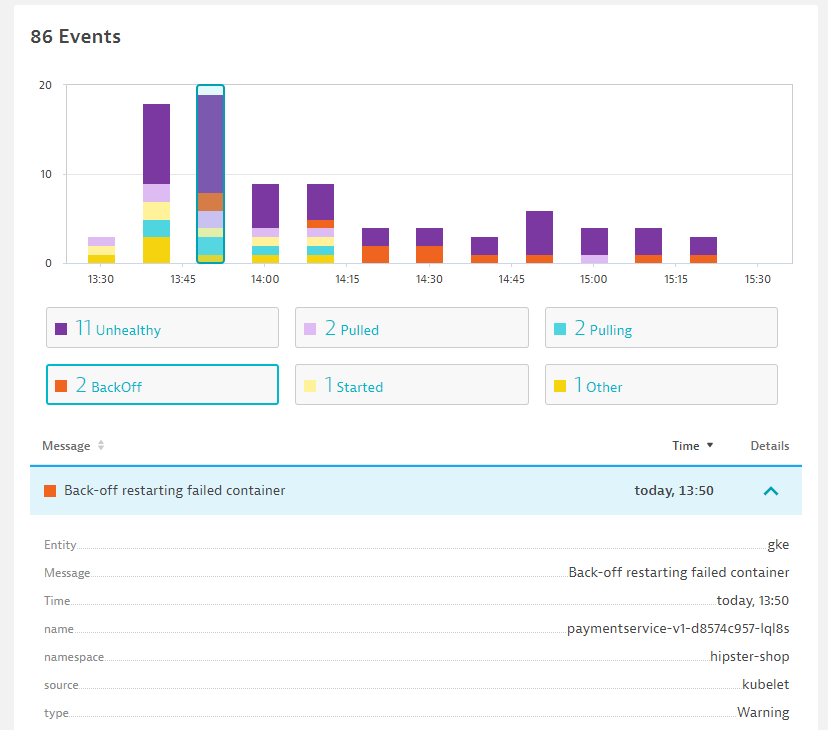
Analyze the Kubernetes Events
- Notice the different types of events BackOff, Unhealthy
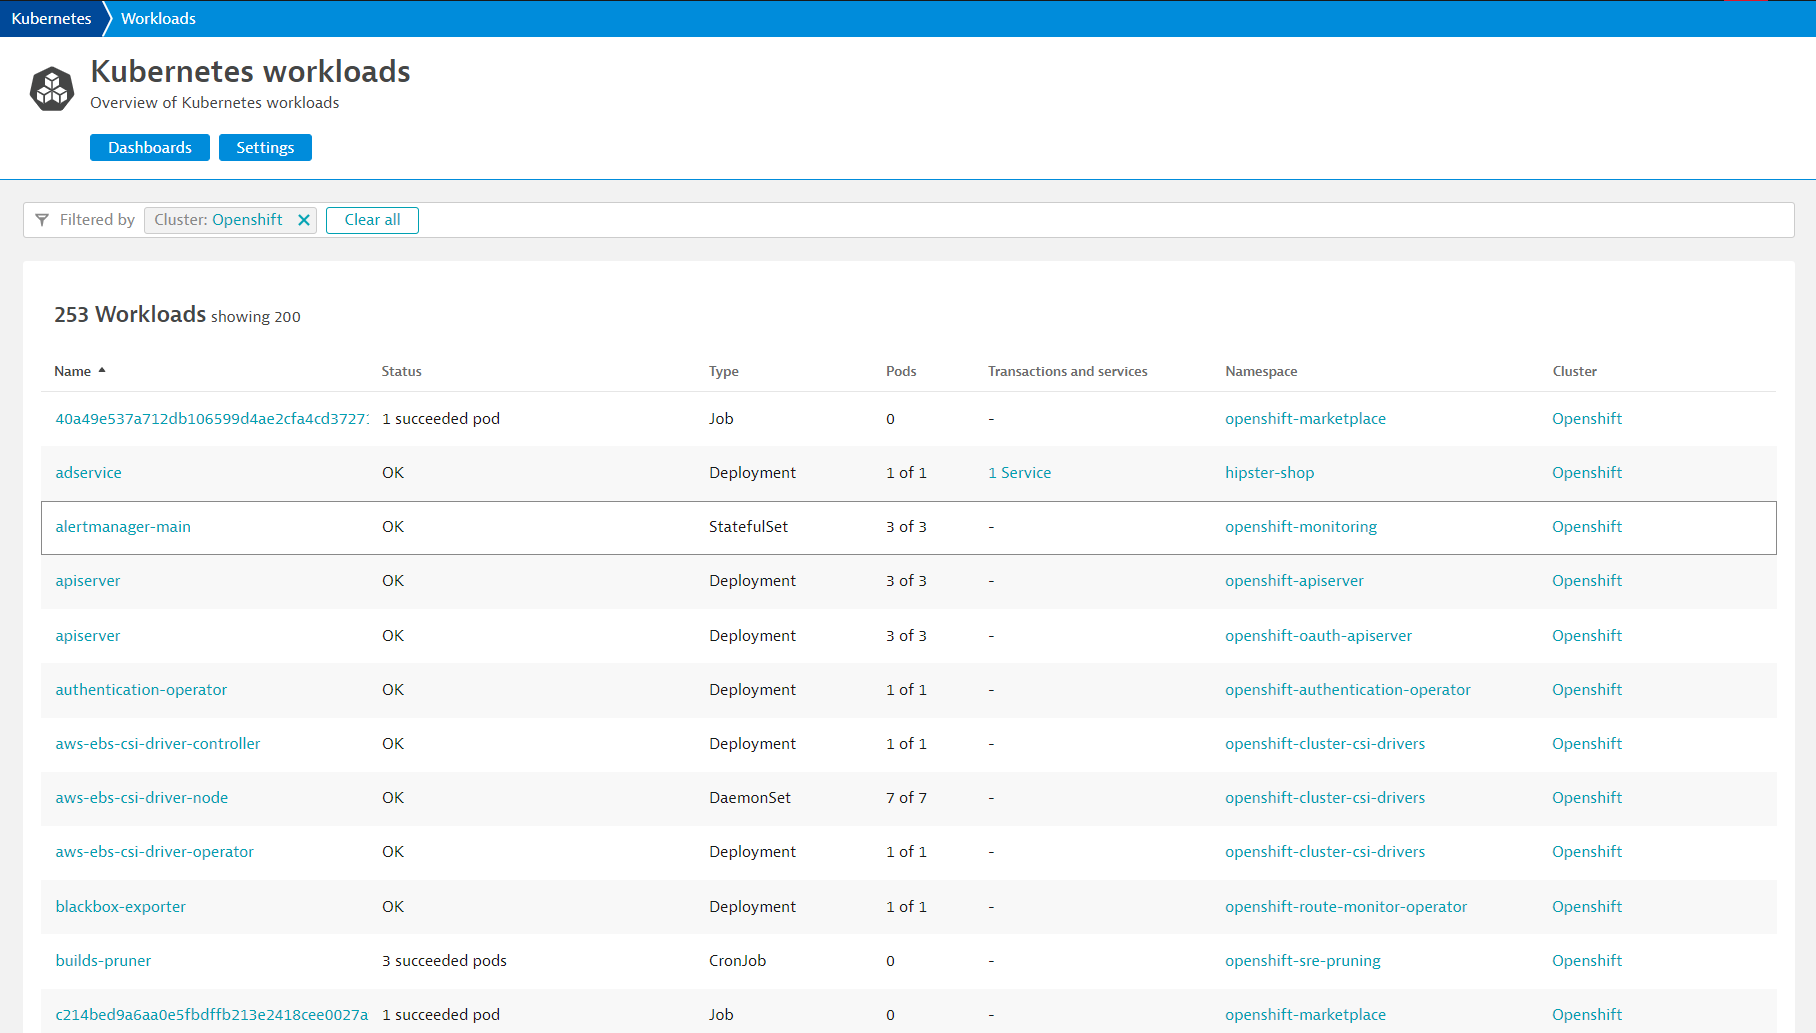
Explore Kubernetes Workloads by clicking onto them
- Click onto each of them and discover their supporting technologies
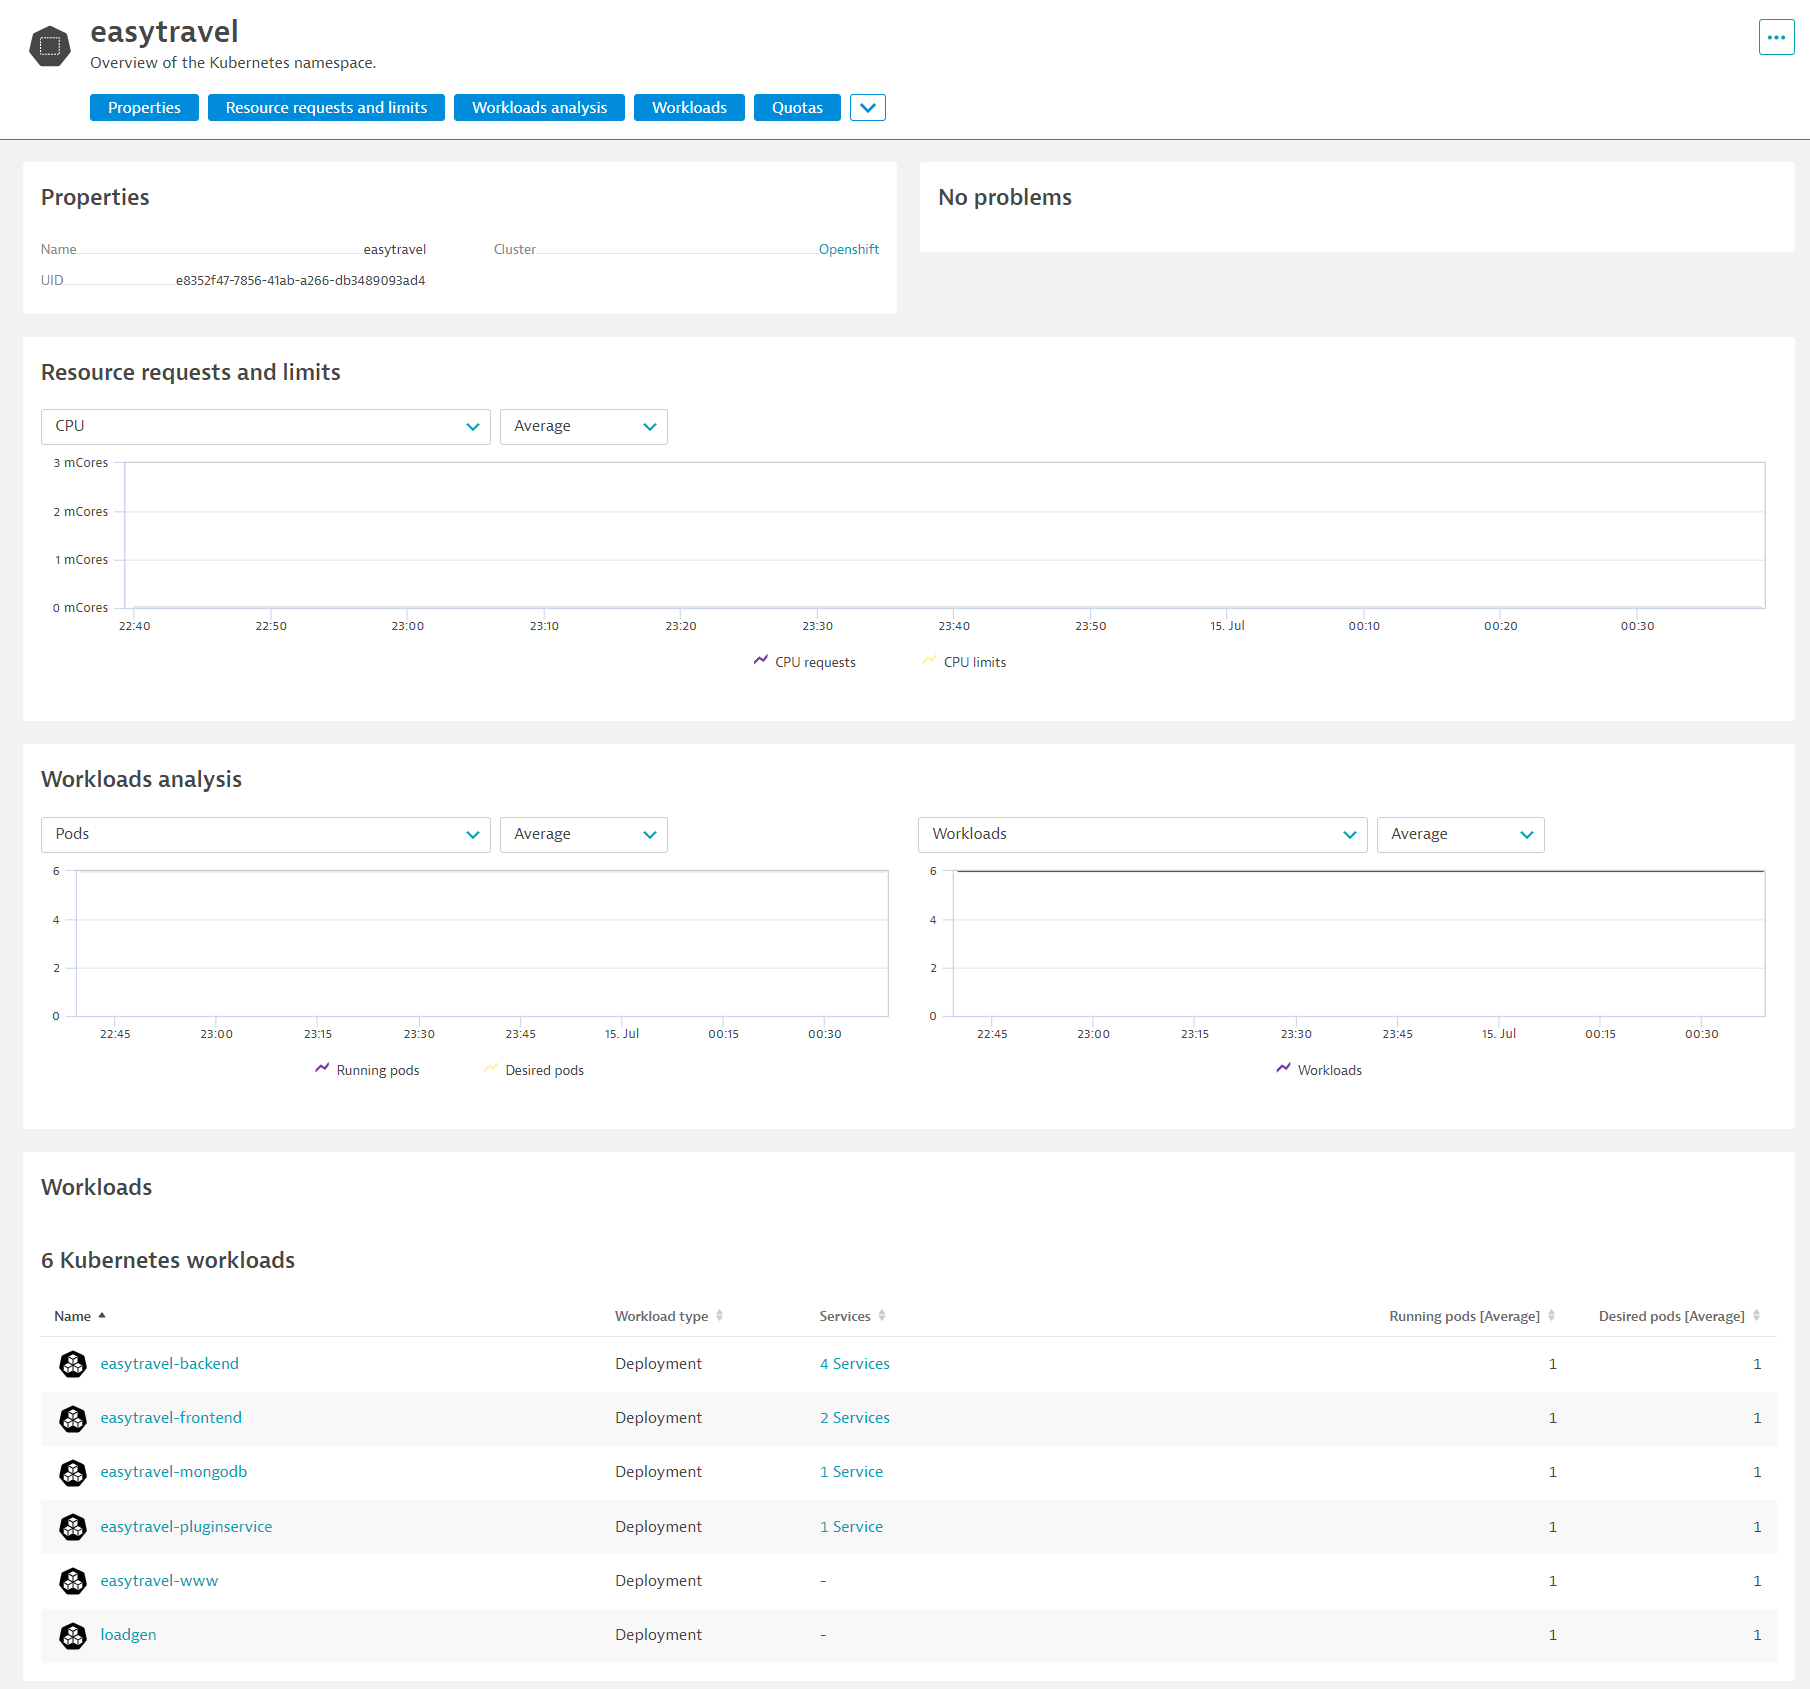
Explore Kubernetes Namespaces and their workloads
- Click onto each of them and discover their utilization and workloads
Dynatrace allows multiple ways to extend the observability of your environment.
Setup etcd for Openshift
To get deeper insights into your self-managed OpenShift control plane, you can also use an extension to extract the etcd metrics exposed on your cluster.
- Select Dynatrace Hub from the navigation menu.
- Type etcd within the filter
- Select etcd for Openshift
- Select Add to environment button from the bottom right.
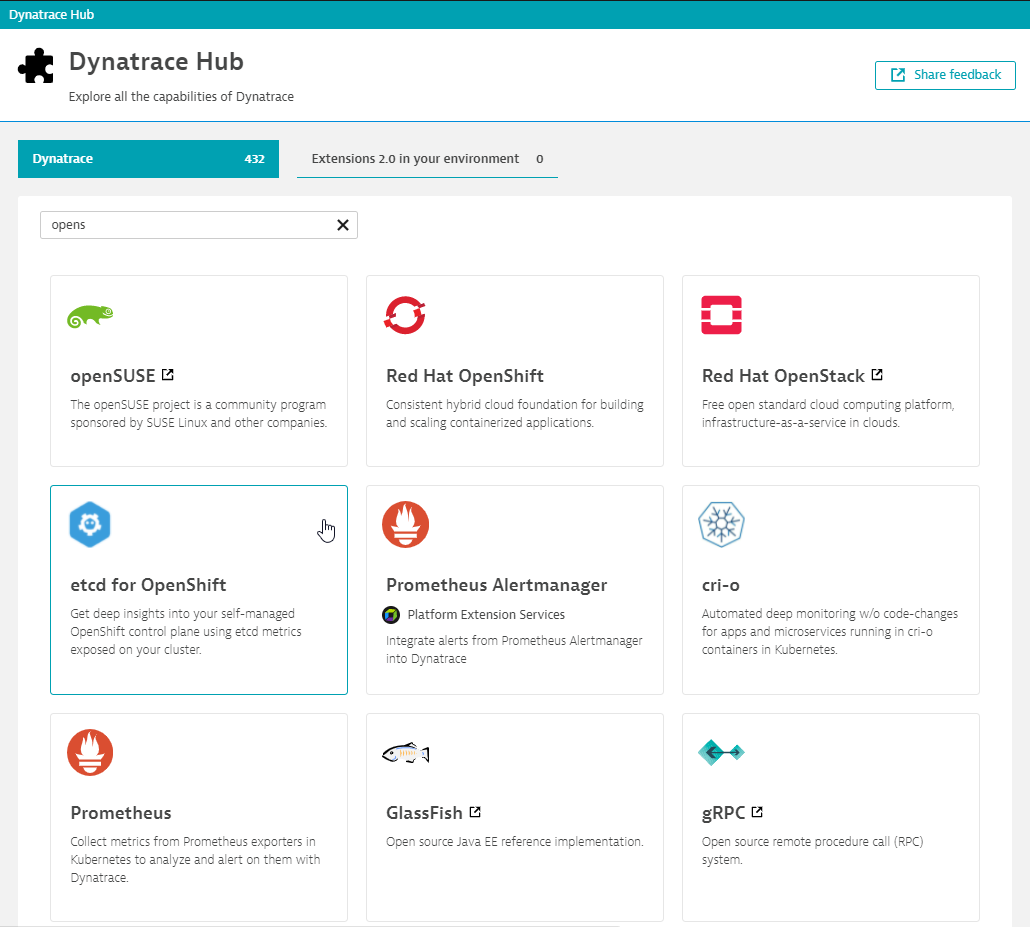
Prometheus
You can also collect metrics from Prometheus exporters in Kubernetes to analyze and alert on them with Dynatrace.
- Select Dynatrace Hub from the navigation menu.
- Type Prometheus within the filter
- Select Prometheus
- Select Activate Prometheus button from the bottom right.
Dynatrace is an all-in-one platform that's purpose-built for a wide range of use cases.
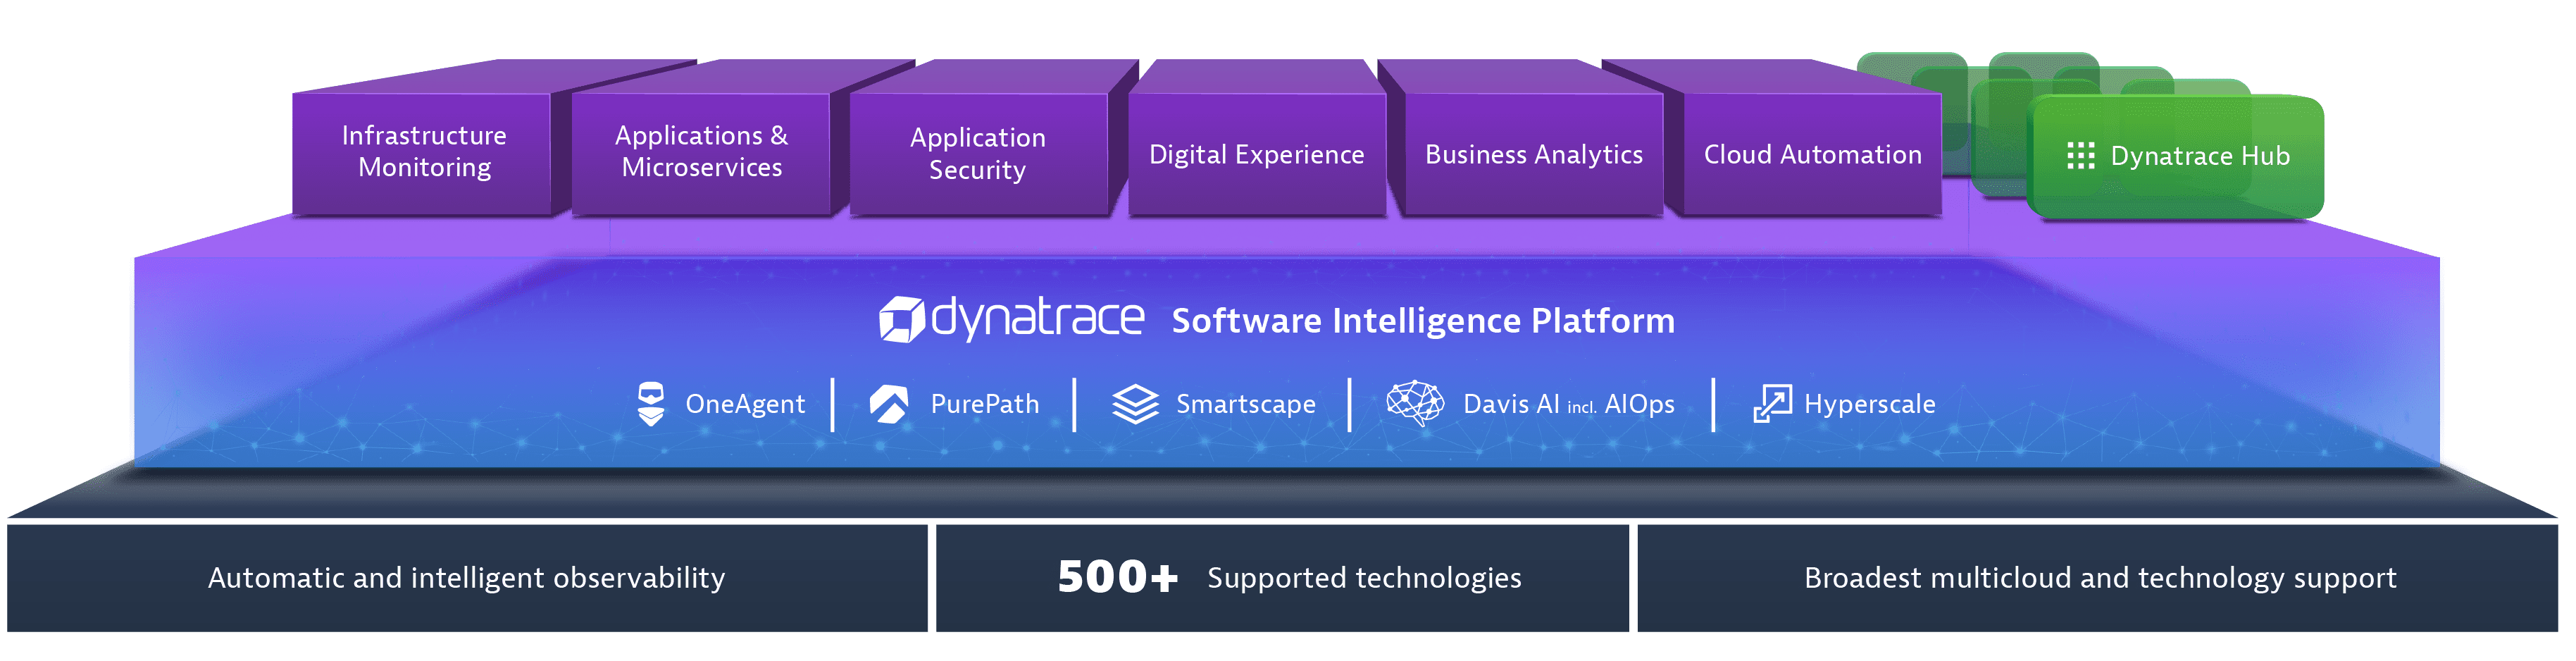
Infrastructure Monitoring
- Dynatrace delivers simplified, automated infrastructure monitoring that provides broad visibility across your hosts, VMs, containers, network, events, and logs. Dynatrace continuously auto-discovers your dynamic environment and pulls infrastructure metrics into our Davis® AI engine, so you can consolidate tools and cut MTTI.
Applications and Microservices
- Dynatrace provides automated, code-level visibility and root-cause answers for applications that span complex enterprise cloud environments. Dynatrace automatically captures timing and code-level context for transactions across every tier. It also detects and monitors microservices automatically across the entire hybrid cloud, from mobile to mainframe.
Digital Experience Monitoring (DEM)
- Dynatrace DEM provides Real User Monitoring (RUM) for every one of your customer's journeys, synthetic monitoring across a global network, and 4K movie-like Session Replay. This powerful combination helps you optimize your applications, improve user experience, and provide superior support across all digital channels.
Digital Business Analytics
- By tying business metrics and KPIs to data that's already flowing through our application performance and digital experience modules, you get real-time, AI-powered answers to your critical business questions.
Cloud Automation
- Dynatrace AIOps gives you precise answers automatically. Dynatrace collects high-fidelity data and maps dependencies in real-time so that the Dynatrace explainable AI engine, Davis®, can show you the precise root causes of problems or anomalies, enabling quick auto-remediation and intelligent cloud orchestration.
The above use cases are setup as labs which you can run through:
- Digital Experience Management with Dynatrace
- Advanced Observability with Dynatrace
- BizOps with Dynatrace
- Autonomous Cloud with Dynatrace
These are also conducted virtually as Hands-On Workshops.
Addtional Resources
- To learn more about what Dynatrace can do for you, watch the videos on Dynatrace Free Trial Resources.
- To learn about our on-premises alternative, read Get started with Dynatrace Managed.