This repository contains labs for the Hands-On Kubernetes Session. We will be using Kubernetes instance running in AWS for this hands-on but this will work on other platforms as well.
For the purposes of the Hands-On, we will automate and make the steps seamless for the participants
Prerequisites
- Dynatrace SaaS/Managed Account. Get your free SaaS trial here.
- SSH client such as mobaxterm.
- Chrome Browser
What You'll Learn
- Deploying Dynatrace Operator
- Explore Automatic Kubernetes Dashboards
- Kubernetes Labels & Annotations
- Process Group Naming & Service Naming for Kubernetes
- Discover various Kubernetes View on Dynatrace
- Kubernetes Namespace
- Kubernetes Workloads
- Kubernetes Containers / Pods
In this exercise, we will deploy the OneAgent to a Linux instance running Kubernetes(Microk8s) and let the OneAgent discover what is running in that instance.
Using Terminal via Web Browser
To faciliate the labs, we will access the Linux instance via terminal through a web browser.
Use the URL was provided in your email to access the browser-based terminal. Please follow the instructions in your email.
If you are still not able to use the web browser, you can download any SSH client like PuTTy or MobaXterm and access the session via the SSH client.
Use the login name and password as provided in your email. It works for any method of access.
Download the OneAgent
Open your browser and access the Dynatrace URL.
Follow these steps below:
- Search for Hub from the navigation menu.
- Star it to add to favourites and click on it.
- Select Kubernetes
- Select Monitor Kubernetes button from the bottom right.
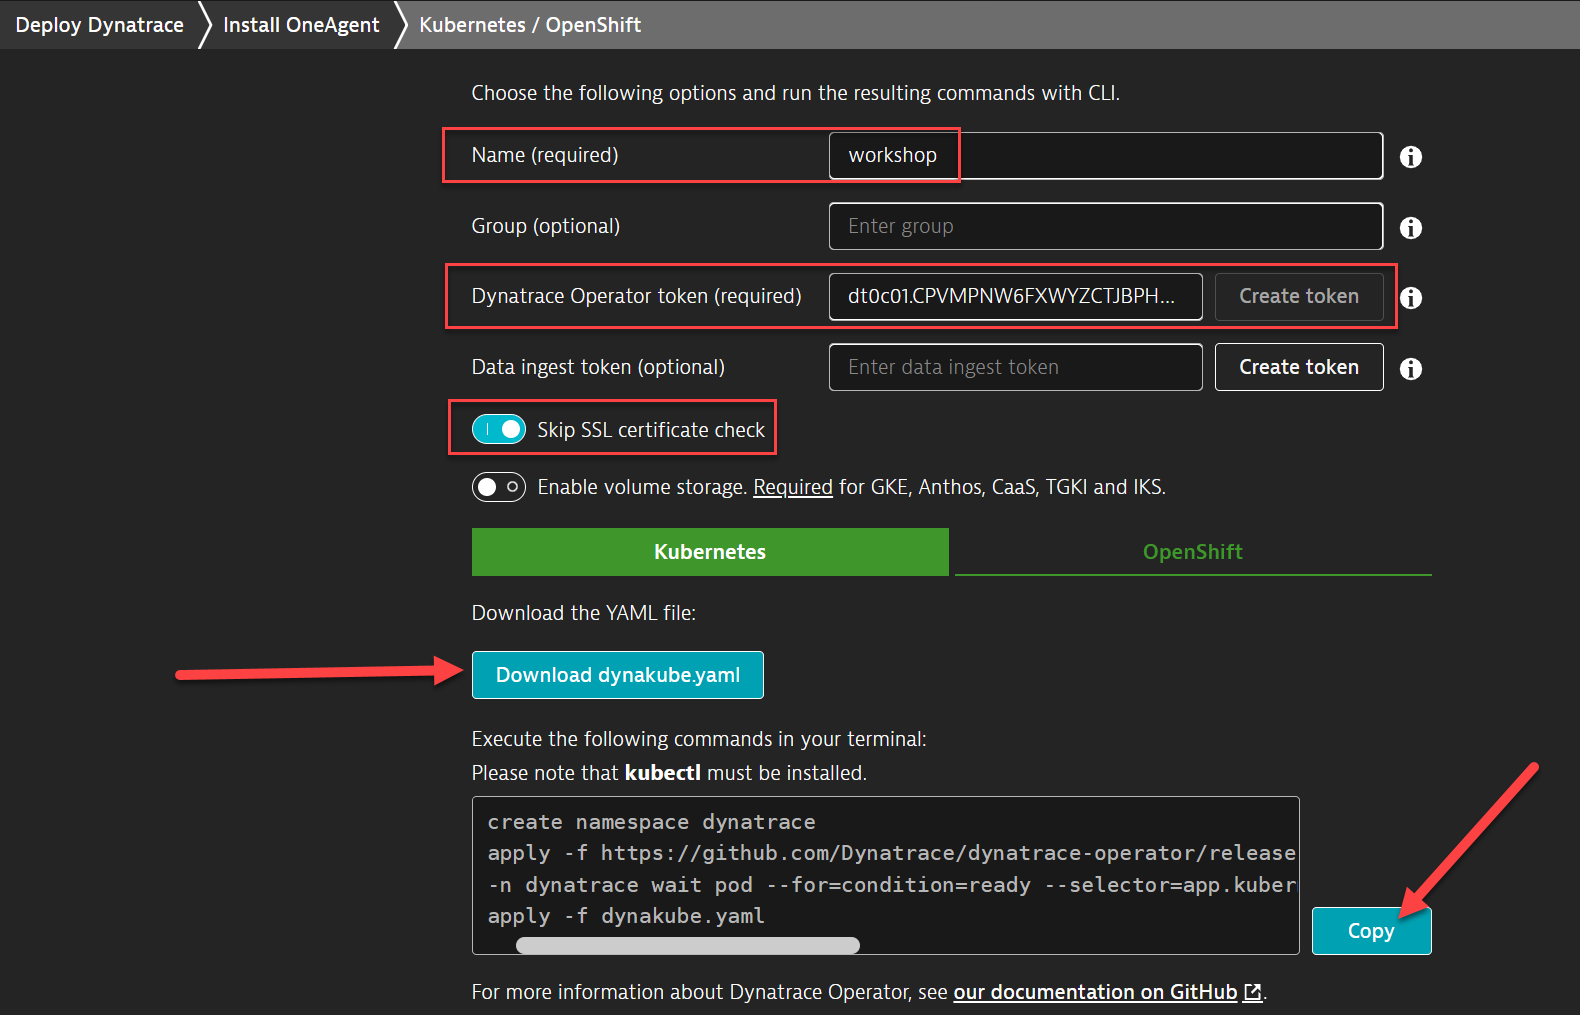
Within the Monitor Kubernetes / Openshift page, follow these steps below:
- Enter a Name for the connection Example:
k8sorworkshop - Click on Create token to create the Dynatrace operator token (all other tokens are optional)
- Toggle ON Skip SSL Certificate Check
- Download the dynakube.yaml file
- Either upload it to the browser-based terminal or create a yaml file and copy the contents to that file in the terminal session.
- Click Copy button to copy the commands.
- Paste the command into your terminal window and execute it.
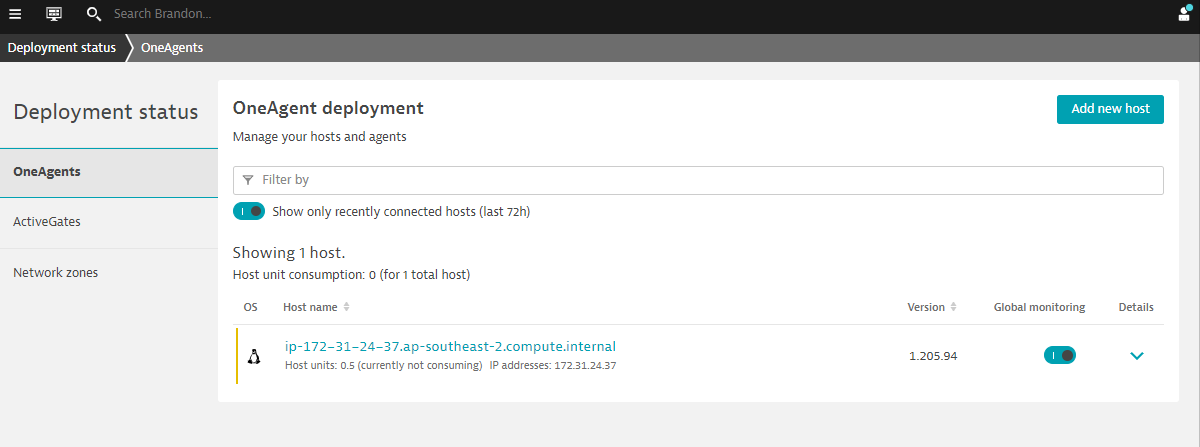
Validate the installation in Deployment status
Click on Show deployment status to check the status of the connected host.
You should be able to see a connected host as per the image below.
⚠️ Troubleshooting steps
If everything is working, you will see the host appearing when you click on Show Deployment status
Restart Sockshop Sample App
You can see the various processes automatically detected but Dynatrace prompts you to restart them. This is required for us to automatically instrument them without code changes.
Run the below command to cycle through your services for Dev and Production.
kubectl delete pods --all -n dev
kubectl delete pods --all -n production
Configuring Kubernetes integration
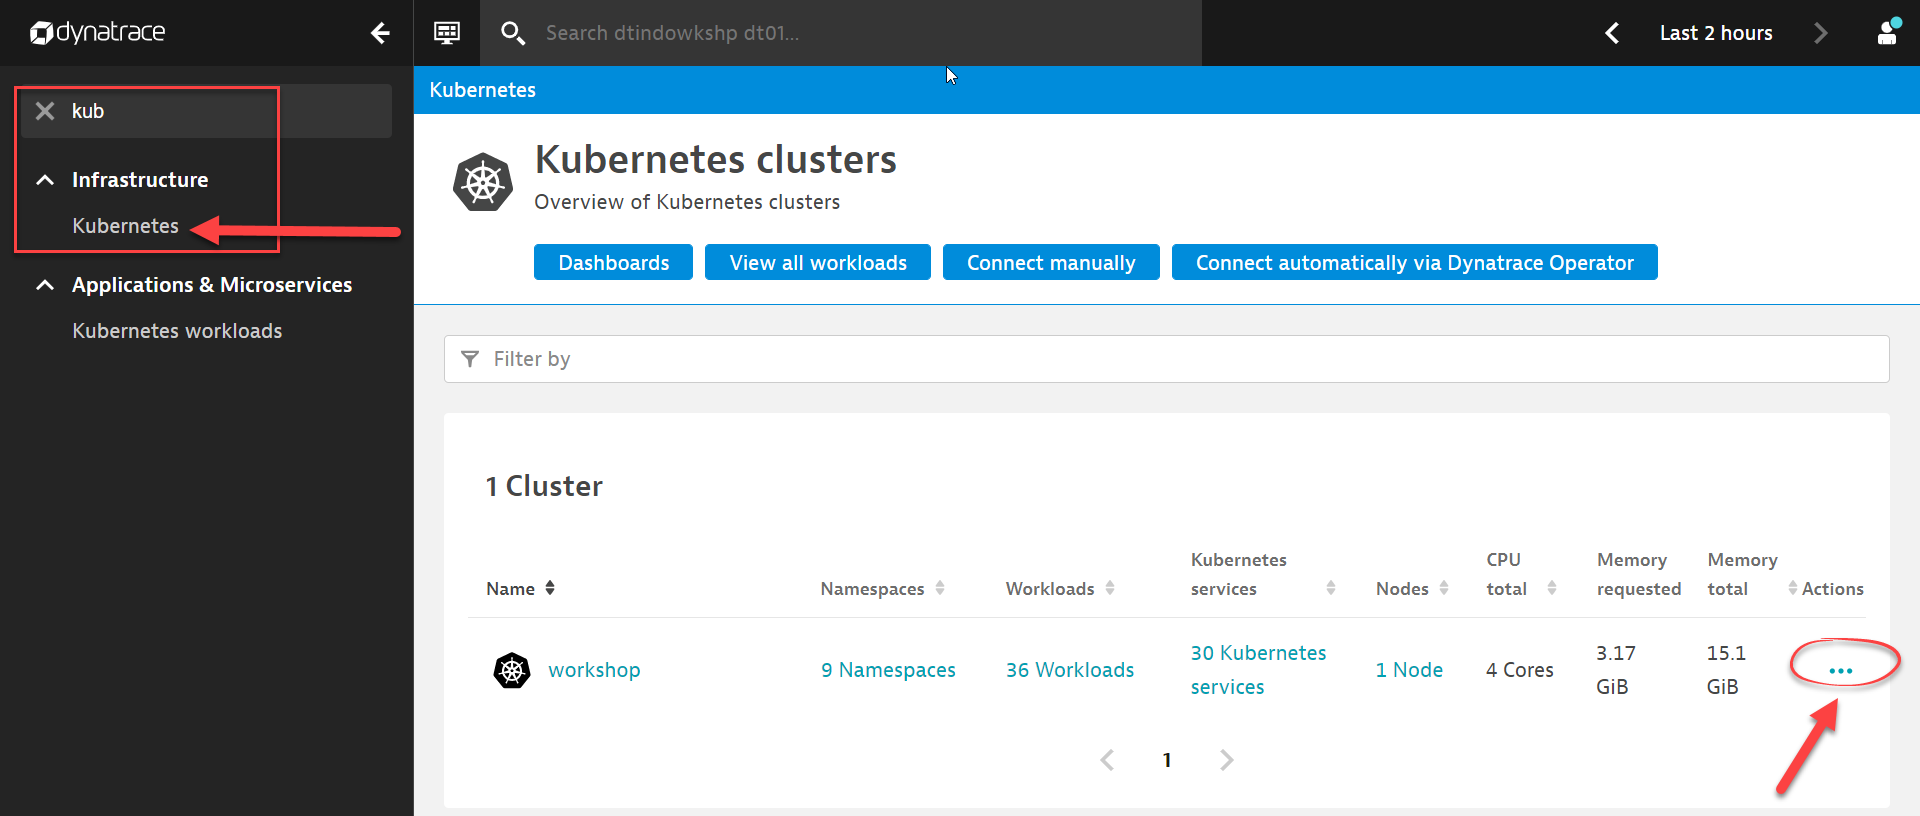
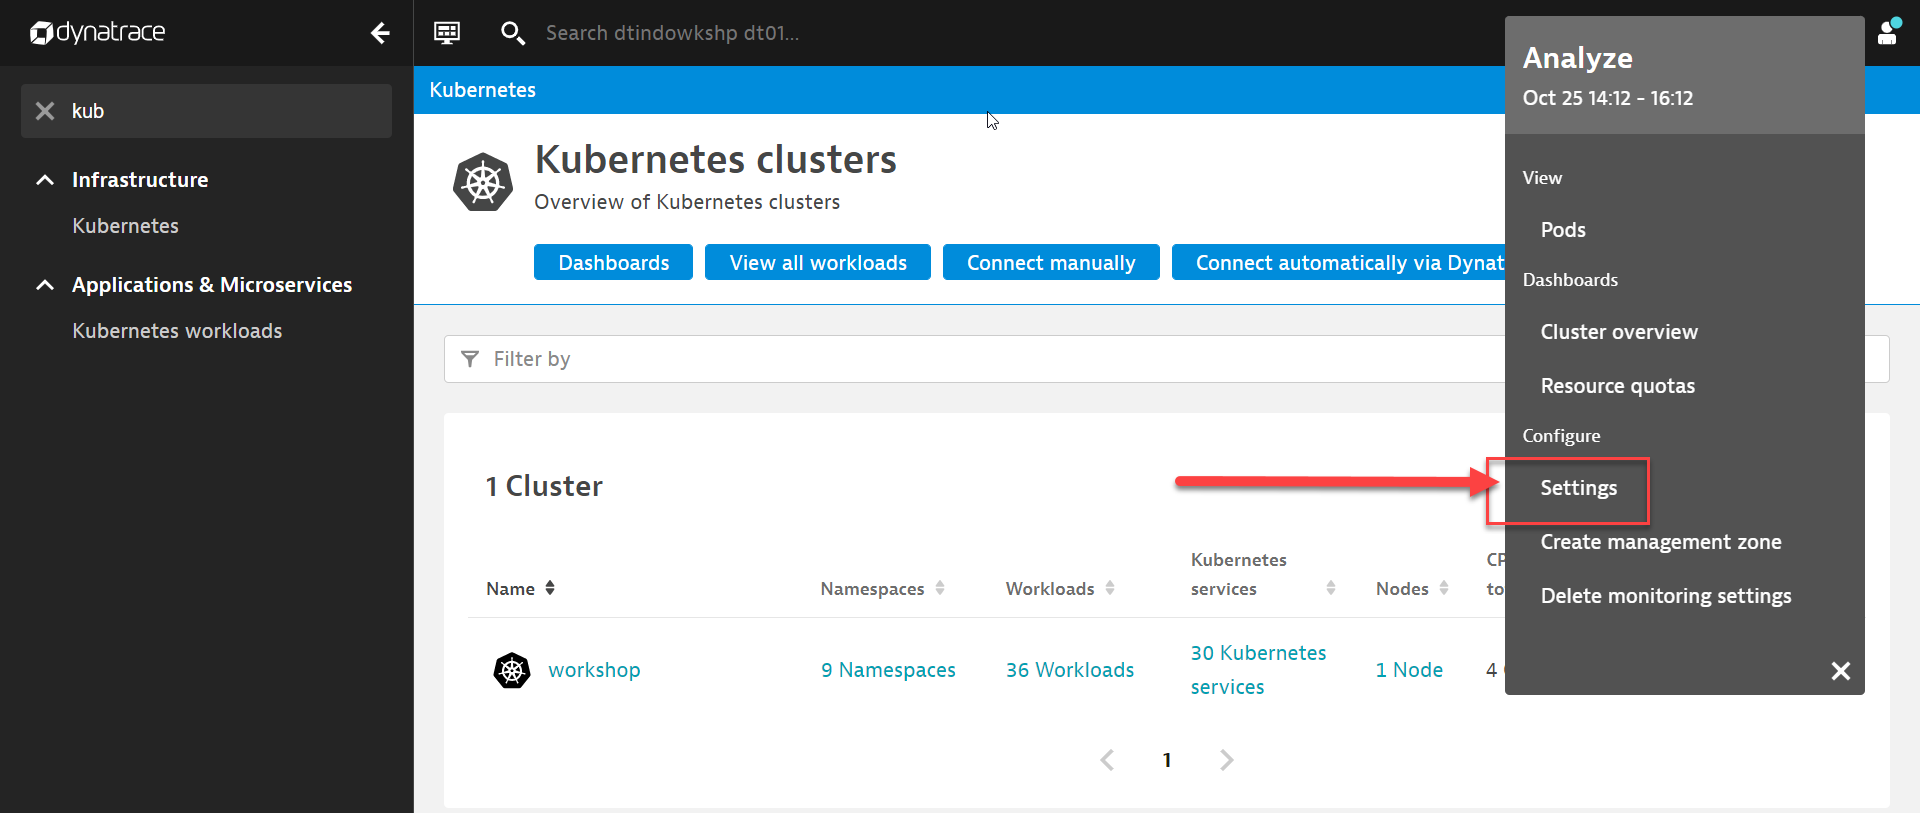
In Dynatrace, open the Dynatrace menu on the left hand side of the screen, you can search for kubernetes and select Kubernetes under the Infrastructure menu.
Click on ... beside the k8s cluster that you named to bring up the context menu.
Once you open up the context menu, click on Settings
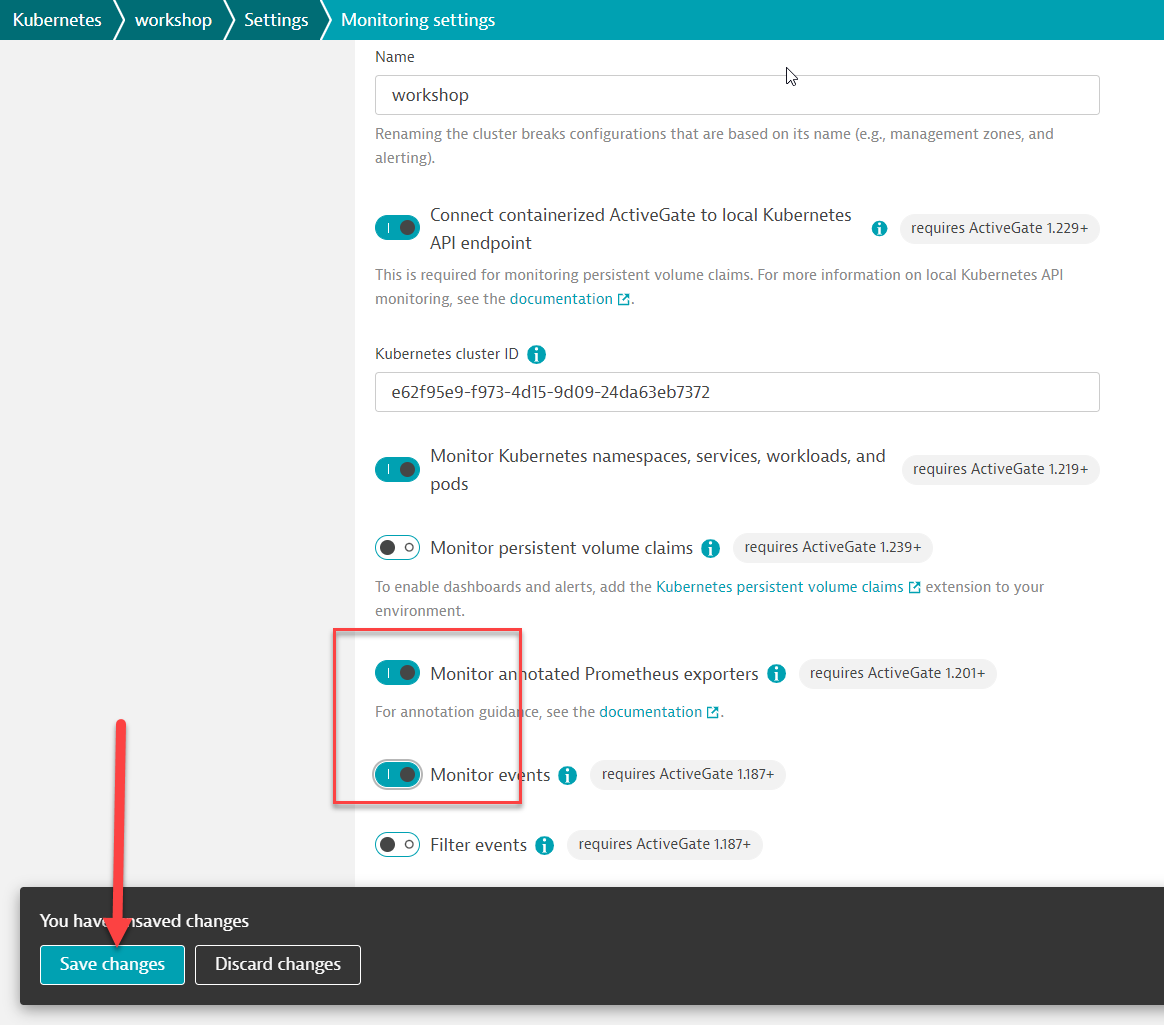
Follow the configuration steps below:
- Toggle ON Monitor annotated Prometheus exporters
- Toggle ON Monitor events
- Click on Save
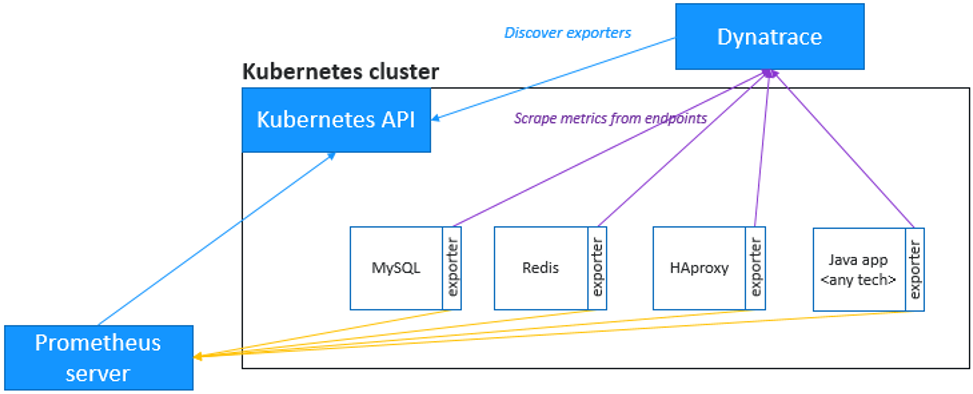
Applications often use 3rd-party technologies, such as Nginx, Redis, RabbitMQ, MySQL and MongoDB, for which additional insights in terms of metrics are required.
Dynatrace provides you the ability to ingest those same Prometheus format metrics, bringing them in the larger context of the microservices and pods, and allowing for enhanced alerting with auto-adaptive baselining of these metrics.
And even better, Dynatrace will scrape the metrics at the source, so you don't even need a Prometheus server.
Annotate Prometheus exporter pods
Back in the shell terminal, run the follow command to annotate the pods for Prometheus scraping
The command will annotate Prometheus metrics for pods within Production namespace
kubectl annotate po -n production --all --overwrite metrics.dynatrace.com/scrape=true
kubectl annotate po -n production --all --overwrite metrics.dynatrace.com/port=8080
Explore the metrics
You will have to wait one or two minutes and then, in the Dynatrace UI:
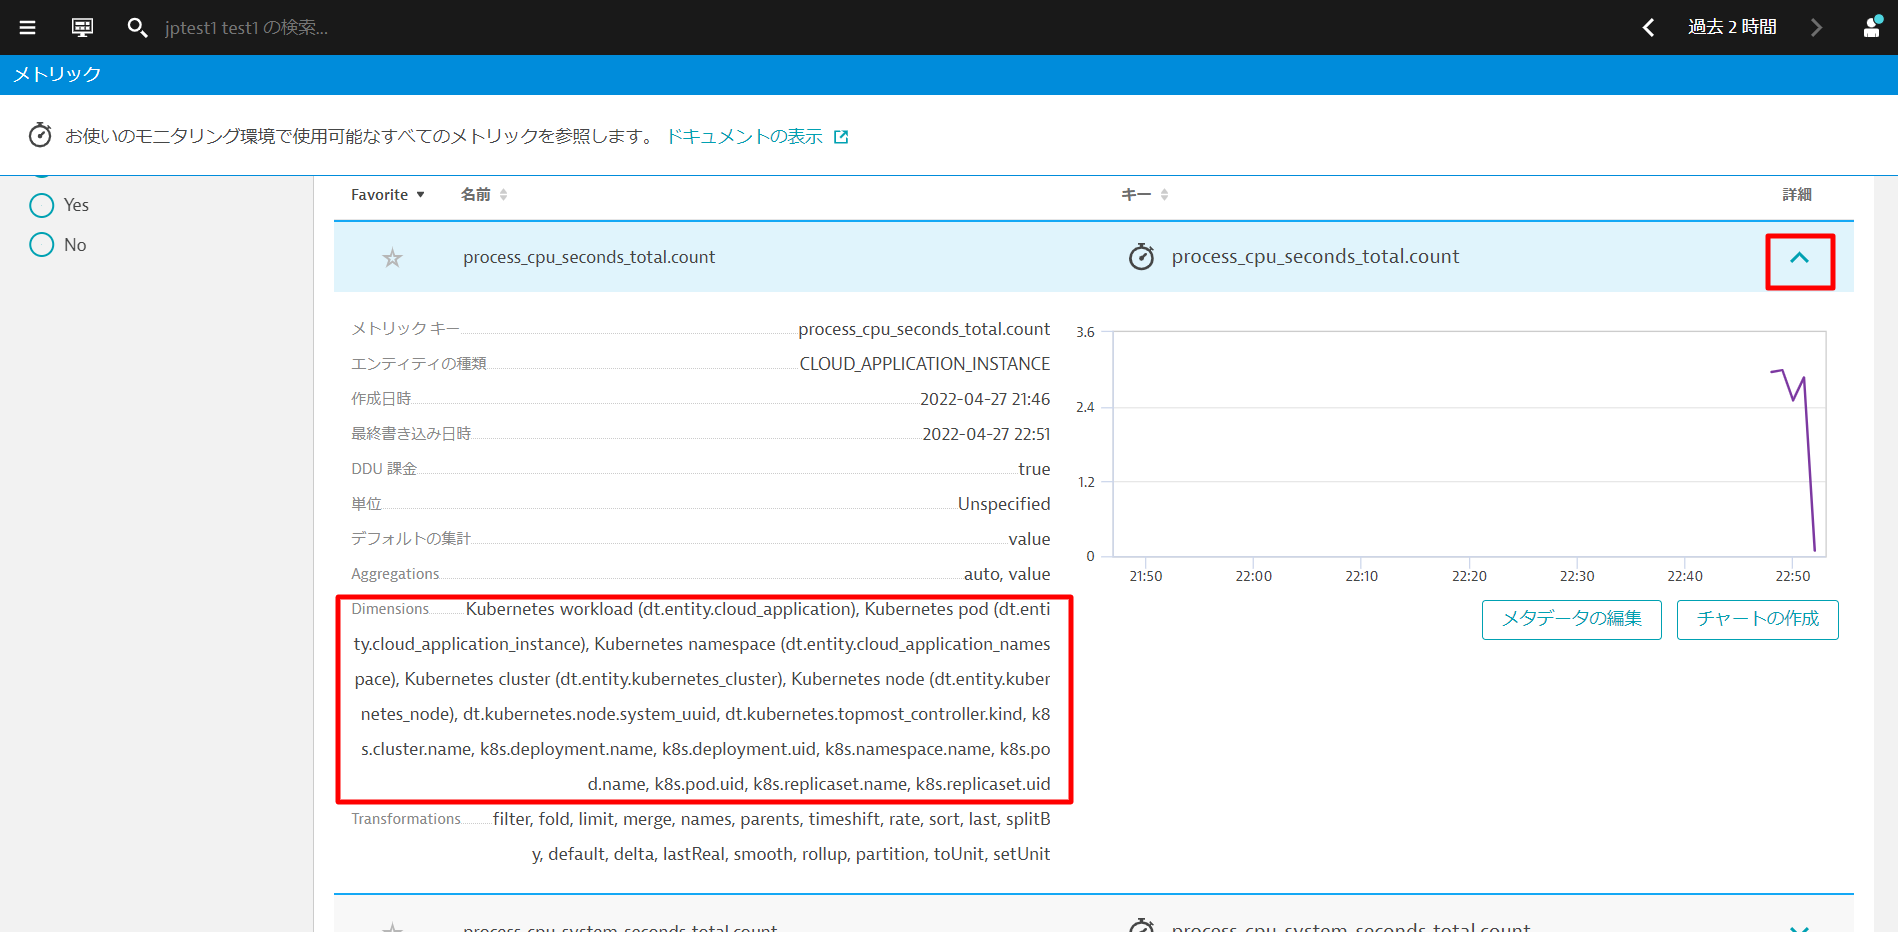
- Go to the Metrics view
- In the filter text box, type
process_, and hit "Enter" key - A few different metrics should be displayed. These are scrapped from Prometheus. If you don't get anything, wait a bit more, refresh the screen and try again
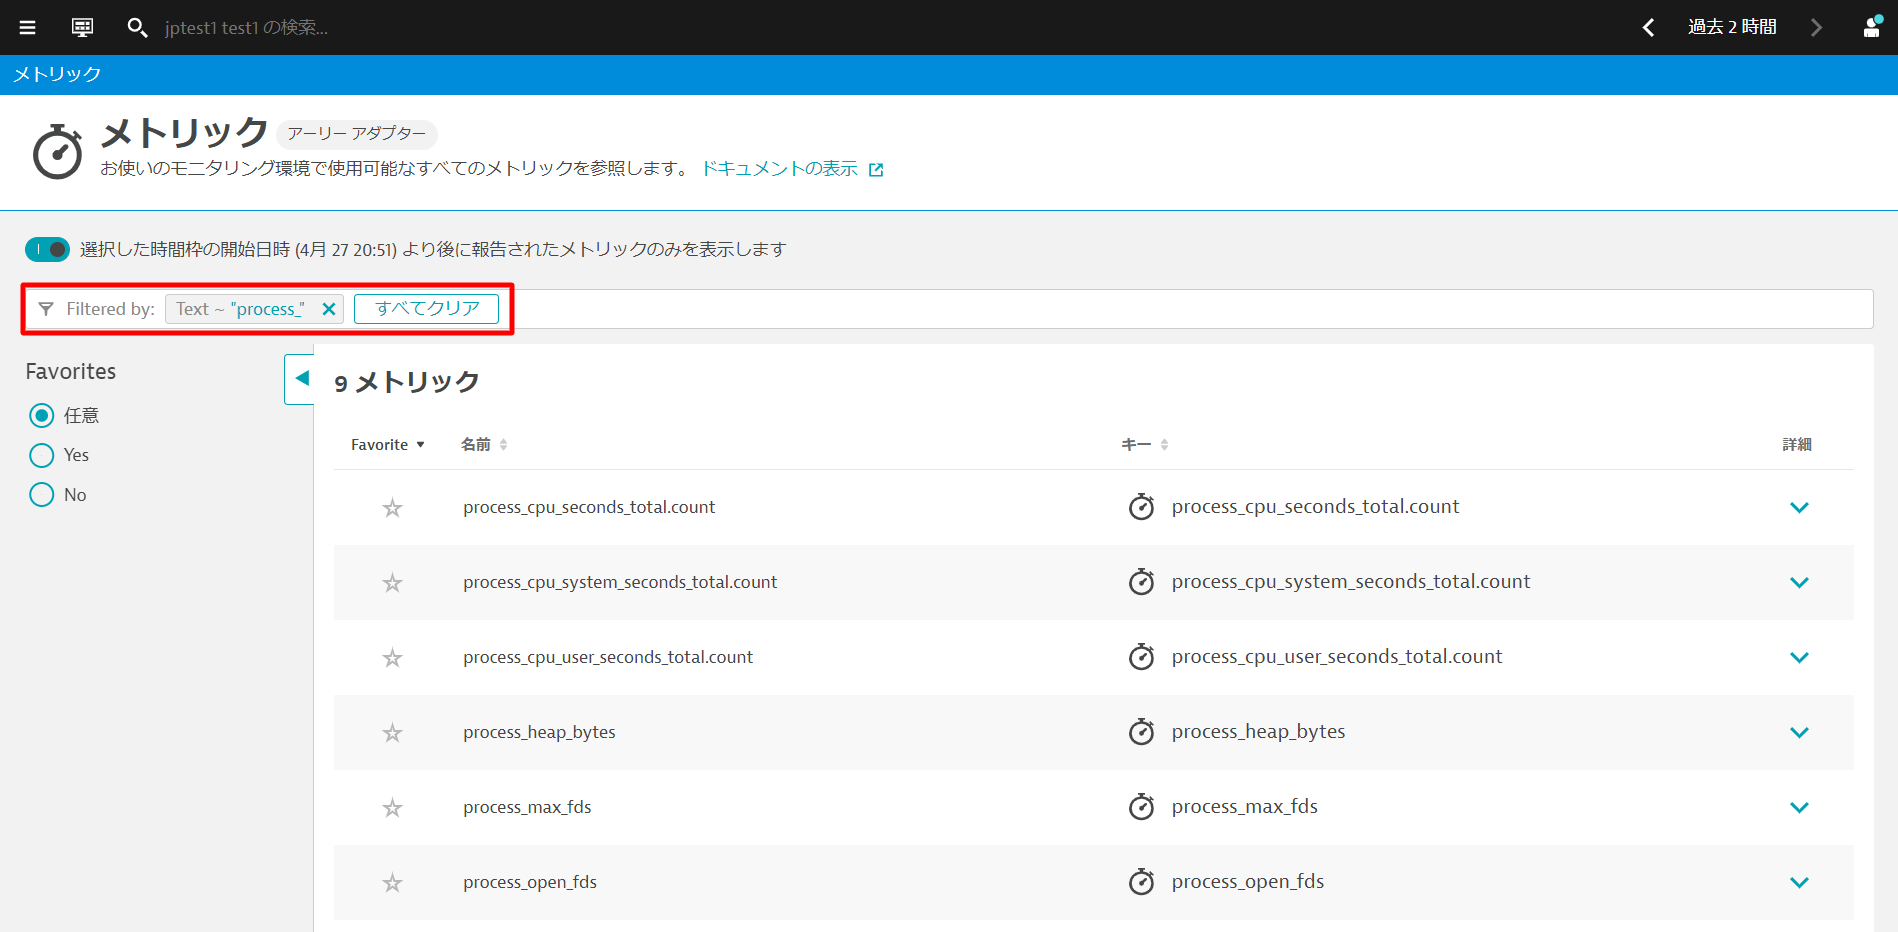
- Go ahead to click on any one of them to explore the metrics collected, including the dimensions. Notice that Dynatrace automatically associates the Kubernetes workloads, namespace, nodes etc., and feeds this into the causation engine!
You can now easily chart these metrics and also create dashboards. We will provide a sample dashboard later in the hands on for your reference.
In addition, you can also create an alert based on the metrics.
How to get custom alerts based on the metrics?
Now you have access to Prometheus metrics in Dynatrace, even though they come from a 3rd party, those metrics are now first class citizens in Dynatrace.
We have already seen that you can visualize those metrics in charts and dashboards all the same as Dynatrace-native metrics.
But, of course, you don't want to spend your days looking at dashboards. What you want is to be notified if there's an anomaly related to the metrics you are capturing.
You can define a custom Anomaly Detection rule for your metric.
Please give this a try if you have time after the session.
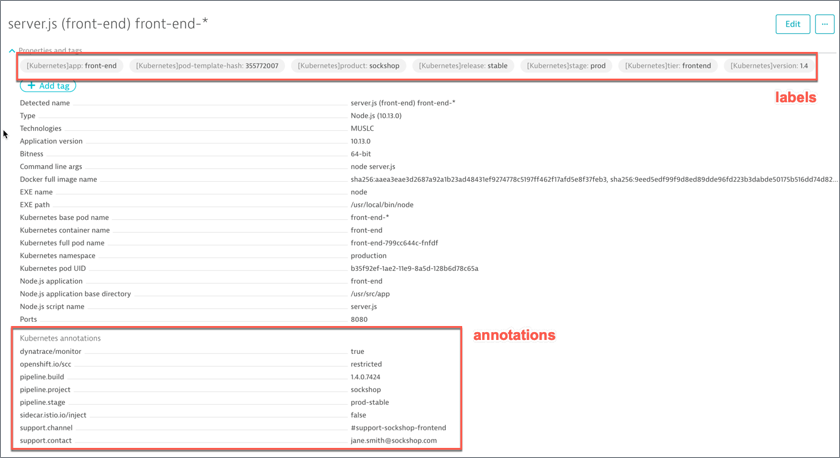
With the Sockshop app restarted, you should be able to see services in Dynatrace.
Referring to ~/sockshop/manifests/sockshop-app/production/front-end.yml, we will want to setup Dynatrace to automatically pick up the annotations and labels.
---
apiVersion: apps/v1
kind: Deployment
metadata:
  creationTimestamp: null
  labels:
    app: front-end.stable
    product: sockshop
    release: stable
    stage: prod
    tier: frontend
    version: "1.4"
  name: front-end.stable
  namespace: production
spec:
  replicas: 1
  selector:
    matchLabels:
      app: front-end.stable
      product: sockshop
      release: stable
      stage: prod
      tier: frontend
      version: "1.4"
  strategy:
    rollingUpdate:
      maxSurge: 1
      maxUnavailable: 1
    type: RollingUpdate
  template:
    metadata:
      annotations:
        pipeline.build: 1.4.0.7424
        pipeline.project: sockshop
        pipeline.stage: prod-stable
        sidecar.istio.io/inject: "false"
        support.channel: '#support-sockshop-frontend'
        support.contact: jane.smith@sockshop.com
      labels:
        app.kubernetes.io/name: front-end
        app.kubernetes.io/version: "1.4"
        app.kubernetes.io/part-of: sockshop
        app: front-end.stable
        product: sockshop
        release: stable
        stage: prod
        tier: frontend
        version: "1.4"
Viewership role for service accounts
The OneAgent will use a pod service account to query for its metadata via the Kubernetes REST API. The service accounts must be granted viewer role in order to have access In the CLI, execute the following command for the production project
kubectl create rolebinding serviceaccounts-view --clusterrole=view --group=system:serviceaccounts:production --namespace=production
You can repeat the procedure for the dev project
kubectl create rolebinding serviceaccounts-view --clusterrole=view --group=system:serviceaccounts:dev --namespace=dev
Wait for the Dynatrace to pickup the change.
Validate
Once working, you can validate the change in Dynatrace
Adding Environment variables
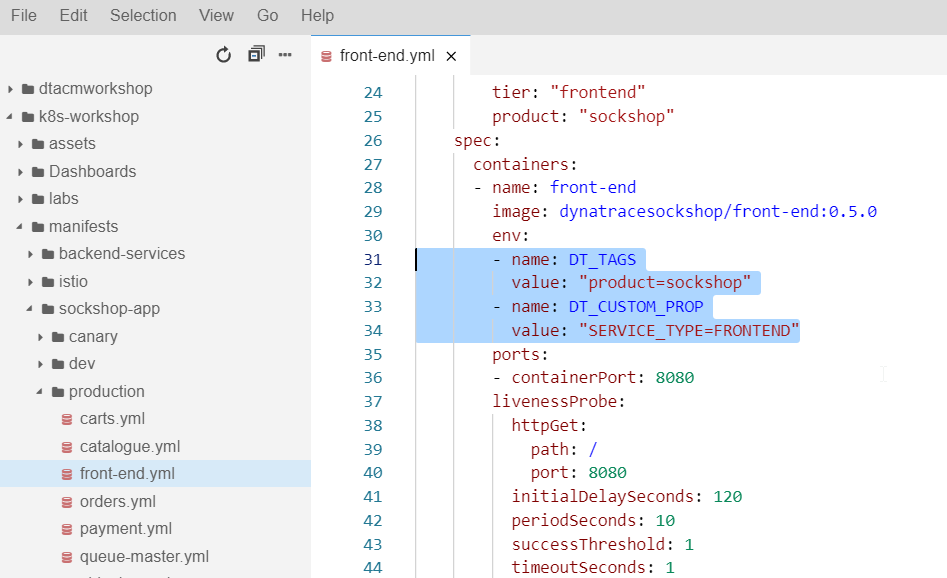
In shell terminal, add some Environment Variables with the following command
nano ~/sockshop/manifests/sockshop-app/production/front-end.yml
Make sure that the indentation is correct and that they aren't any error promptings
        env:
        - name: DT_TAGS
          value: "product=sockshop"
        - name: DT_CUSTOM_PROP
          value: "SERVICE_TYPE=FRONTEND"
Save the amended file with Ctrl-X, followed by Y and Enter and run the below command to re-apply the change.
kubectl apply -f ~/sockshop/manifests/sockshop-app/production/front-end.yml
wget -O- https://raw.githubusercontent.com/Dynatrace-APAC/Workshop-Kubernetes/master/recycle-sockshop-frontend.sh | bash
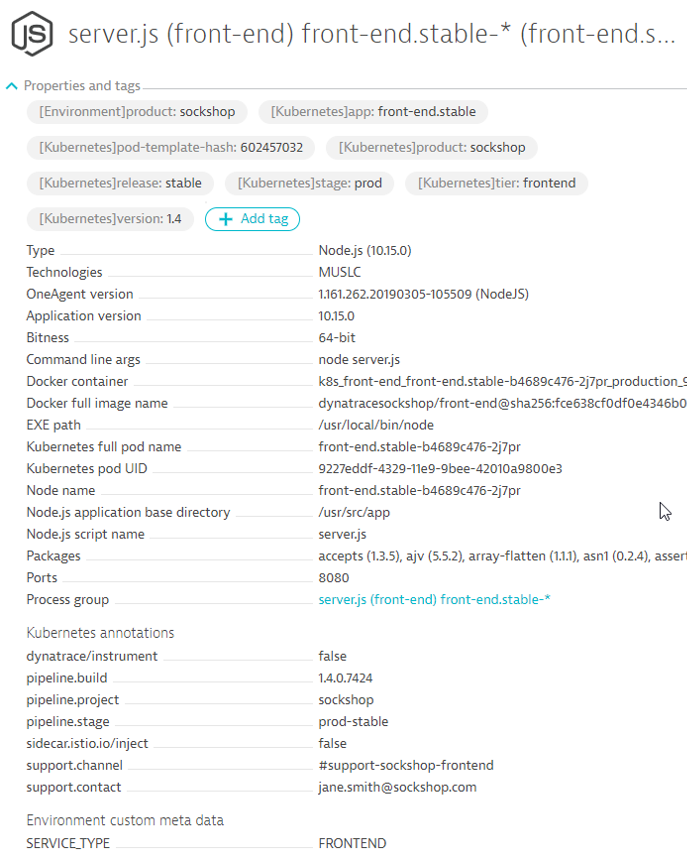
Validate
Once working, you can validate the change in Dynatrace
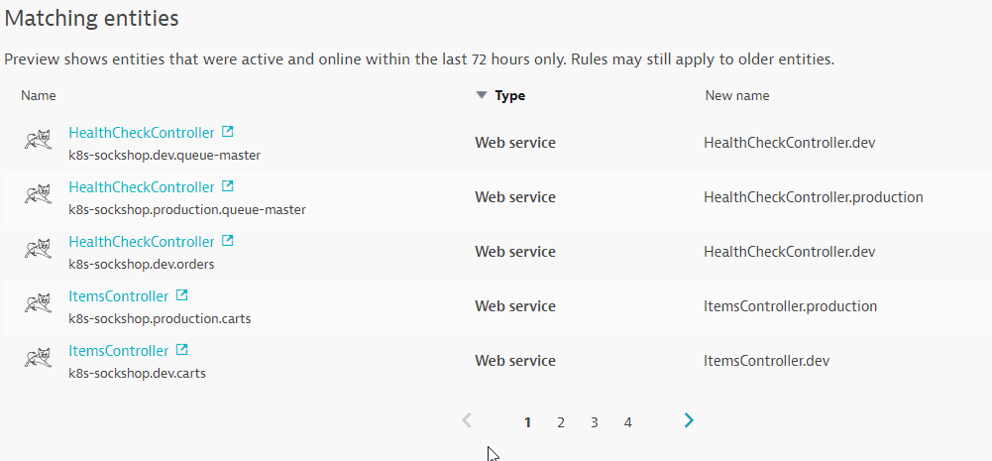
Process Group Naming Rules
Go to Settings -> Processes and containers -> Process group naming and click Add a new rule
Provide a name to the rule, for example : Kubernetes Project.Namespace.Container
Enter this format : k8s-{ProcessGroup:Kubernetes:pipeline.project}.{ProcessGroup:KubernetesNamespace}.{ProcessGroup:KubernetesContainerName}
In the conditions drop-down, select the property Kubernetes namespace and the condition exists
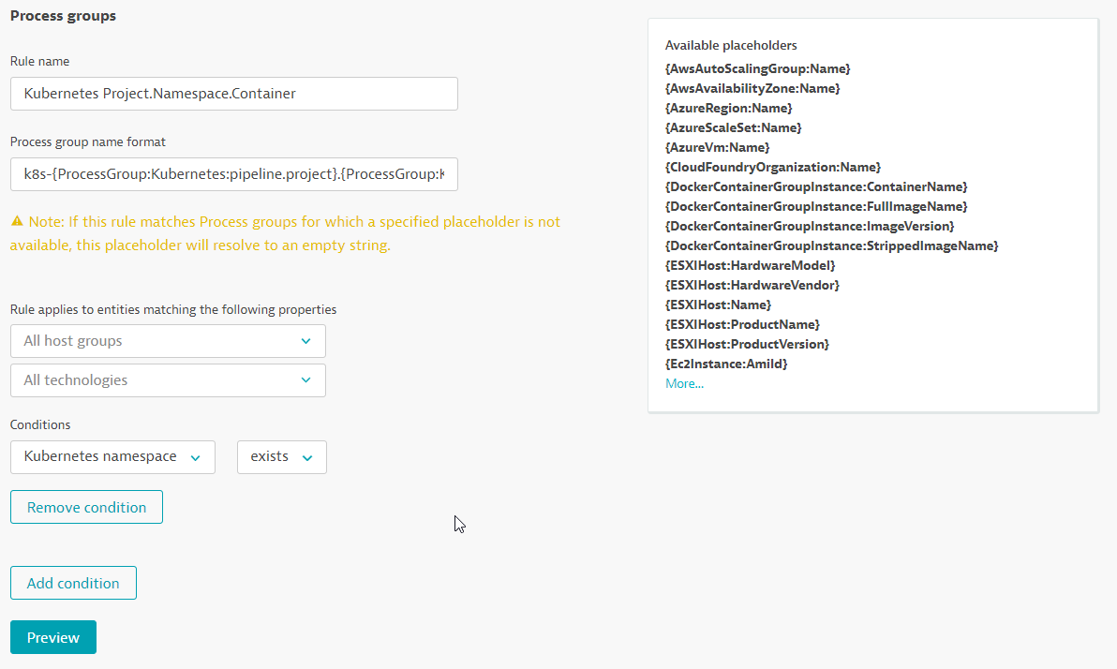
Click on Preview to view the matching entities
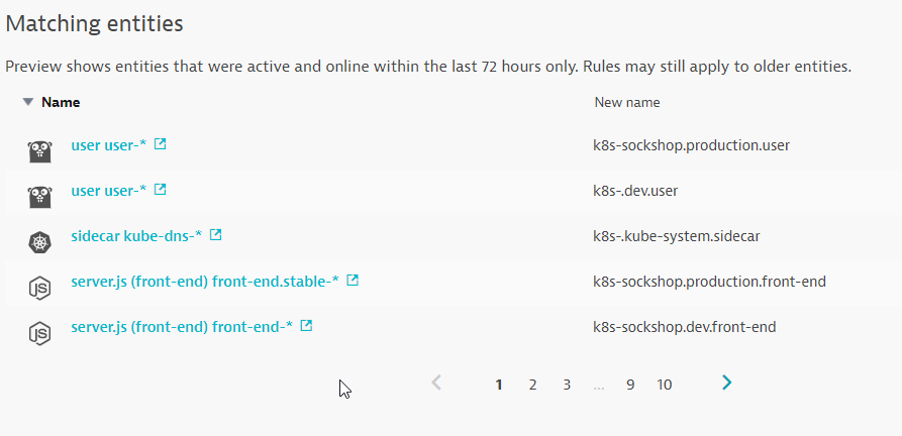
Click on Create Rule and Save Changes in the pop-up.
Validate
Once working, you can validate the change in Dynatrace
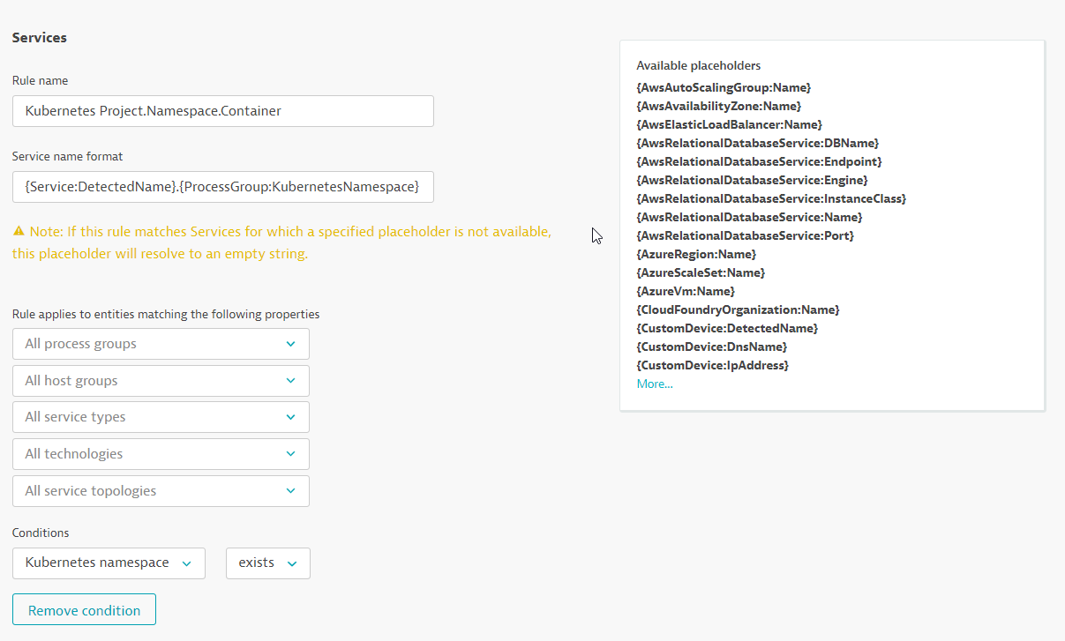
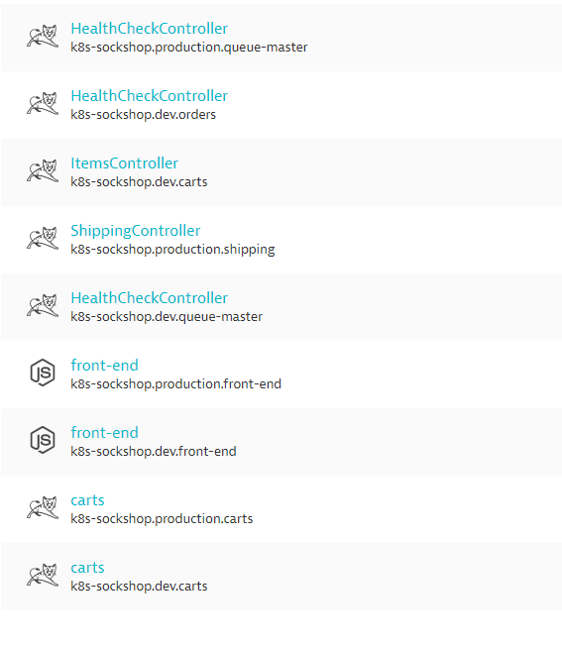
Service Naming Rules
Go in Settings -> Server-side service monitoring -> Service naming rules and click Add a new rule
Provide a name to the rule, for example : Kubernetes Project.Namespace.Container
Enter this format : {Service:DetectedName}.{ProcessGroup:KubernetesNamespace}
In the conditions drop-down, select the property Kubernetes namespace and the condition exists
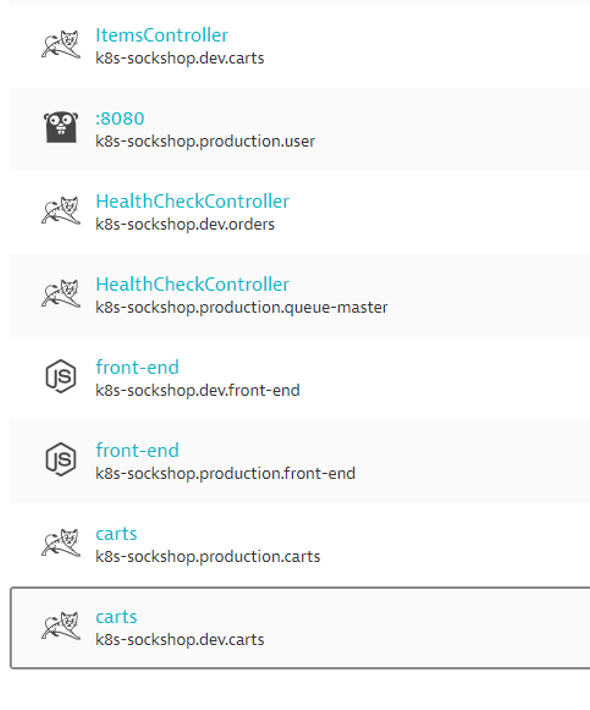
Click on Preview to view the matching entities
Click on Create Rule and Save Changes in the pop-up.
Validate
Once working, you can validate the change in Dynatrace
In this exercise, we will automate configuration of Dynatrace environment.
Using Dynatrace Monitoring as Code (Monaco), you can automate the configuration of all global Dynatrace environments without human intervention. Various use cases include:
- Having the ability to templatize our configuration for reusability across multiple environments
- Interdependencies between configurations should be handled without keeping track of unique identifiers
- Introducing the capability to easily apply – and update – the same configuration to hundreds of Dynatrace environments as well as being able to roll out to specific environments
- Identify an easy way to promote application specific configurations from one environment to another – following their deployments from development, to hardening to production.
- Support all the mechanisms and best-practices of git-based workflows such as pull requests, merging and approvals
- Configurations should be easily promoted from one environment to another following their deployment from development to hardening to production
To faciliate the session, you can run the monaco code with the below:
cd sockshop
./deploy-monaco.sh
After setting it up, configure the DT_TENANT and DT_API_TOKEN and DT_DASHBOARD_OWNER variables. These can be found within the lab registration email.
export DT_TENANT=<replace with the information given to you in the email>
export DT_API_TOKEN=<replace with the information given to you in the email>
export DT_DASHBOARD_OWNER=<replace with the information given to you in the email>
After setting up, run the following command to configure Dynatrace:
./push-monaco.sh
Below are the configurations done:
- Synthetic monitoring
- Service naming rules
- Carts SLO
- Application definitions
- Dashboards
- Process naming rules
- Management zones
Explore the various preset dashboards and some customized dashboards.
On the Dynatrace menu, filter for Dashboards and explore any of the preset kubernetes dashboards. We have also created a custom dashboard named Prometheus ovewview
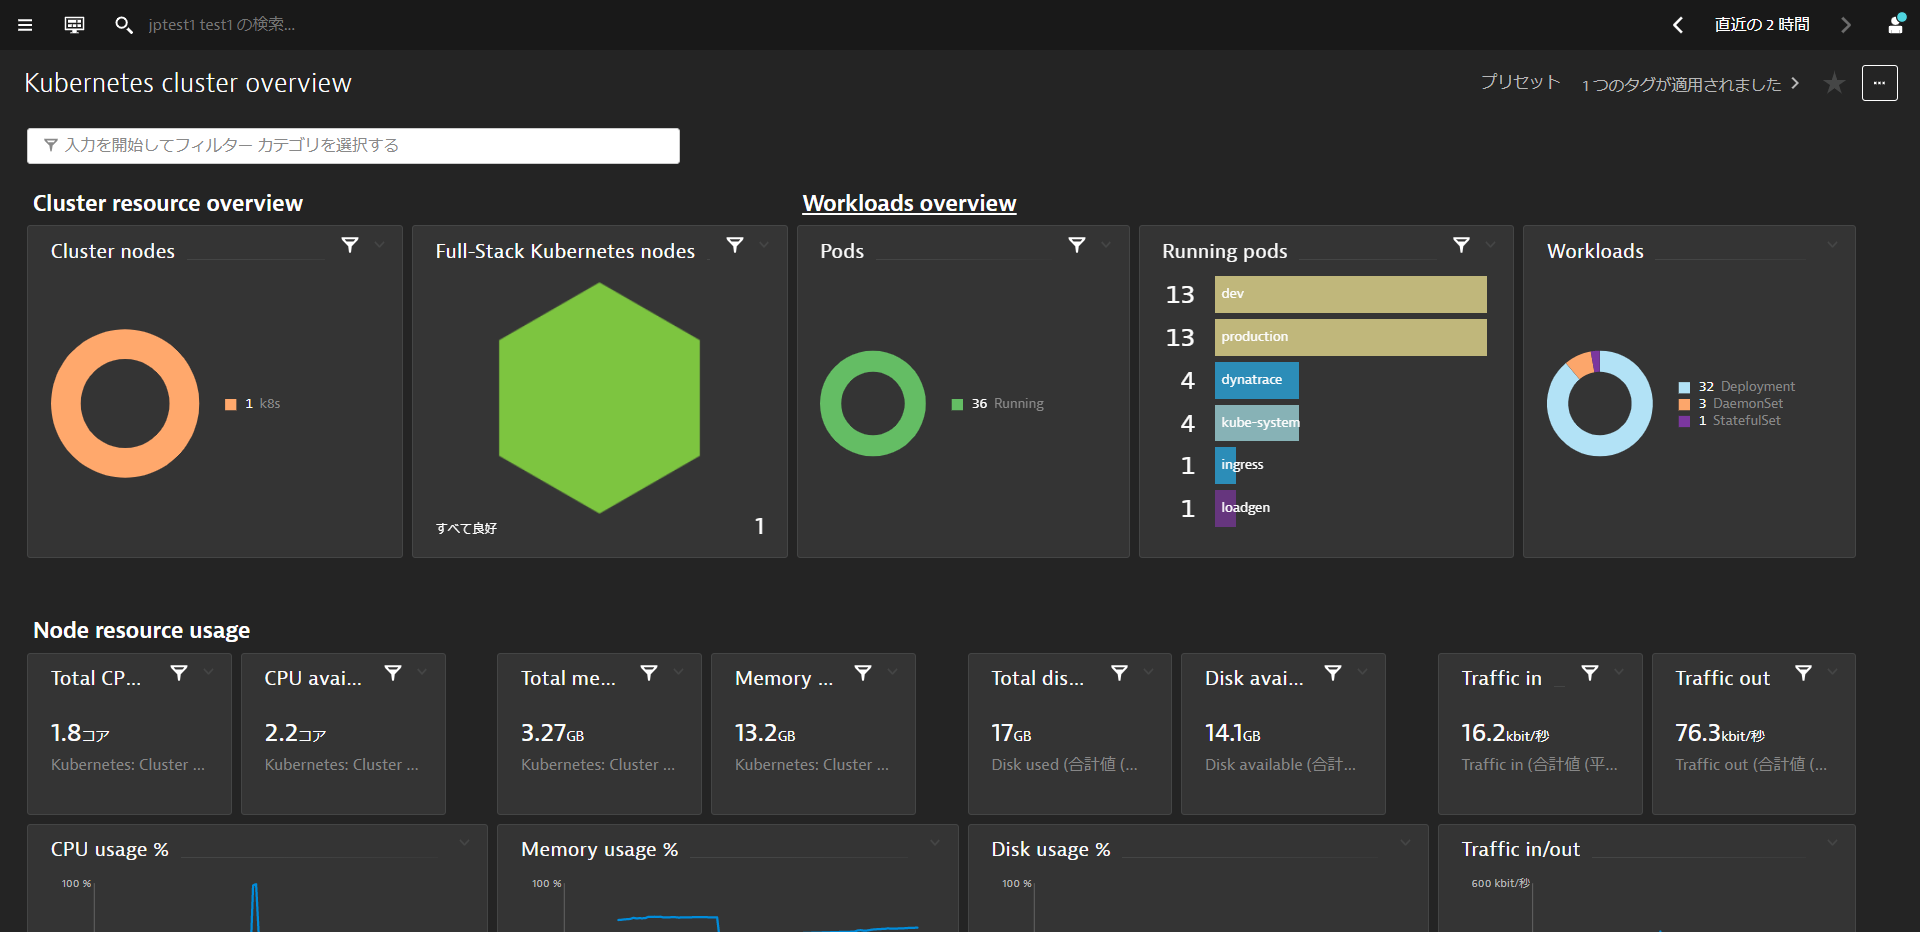
Kubernetes Cluster Overview
See the Kubernetes cluster utilization. CPU and Memory Request and limits over time for all nodes and splitted by namespaces. You could also use the filter bar to filter the dashboard.
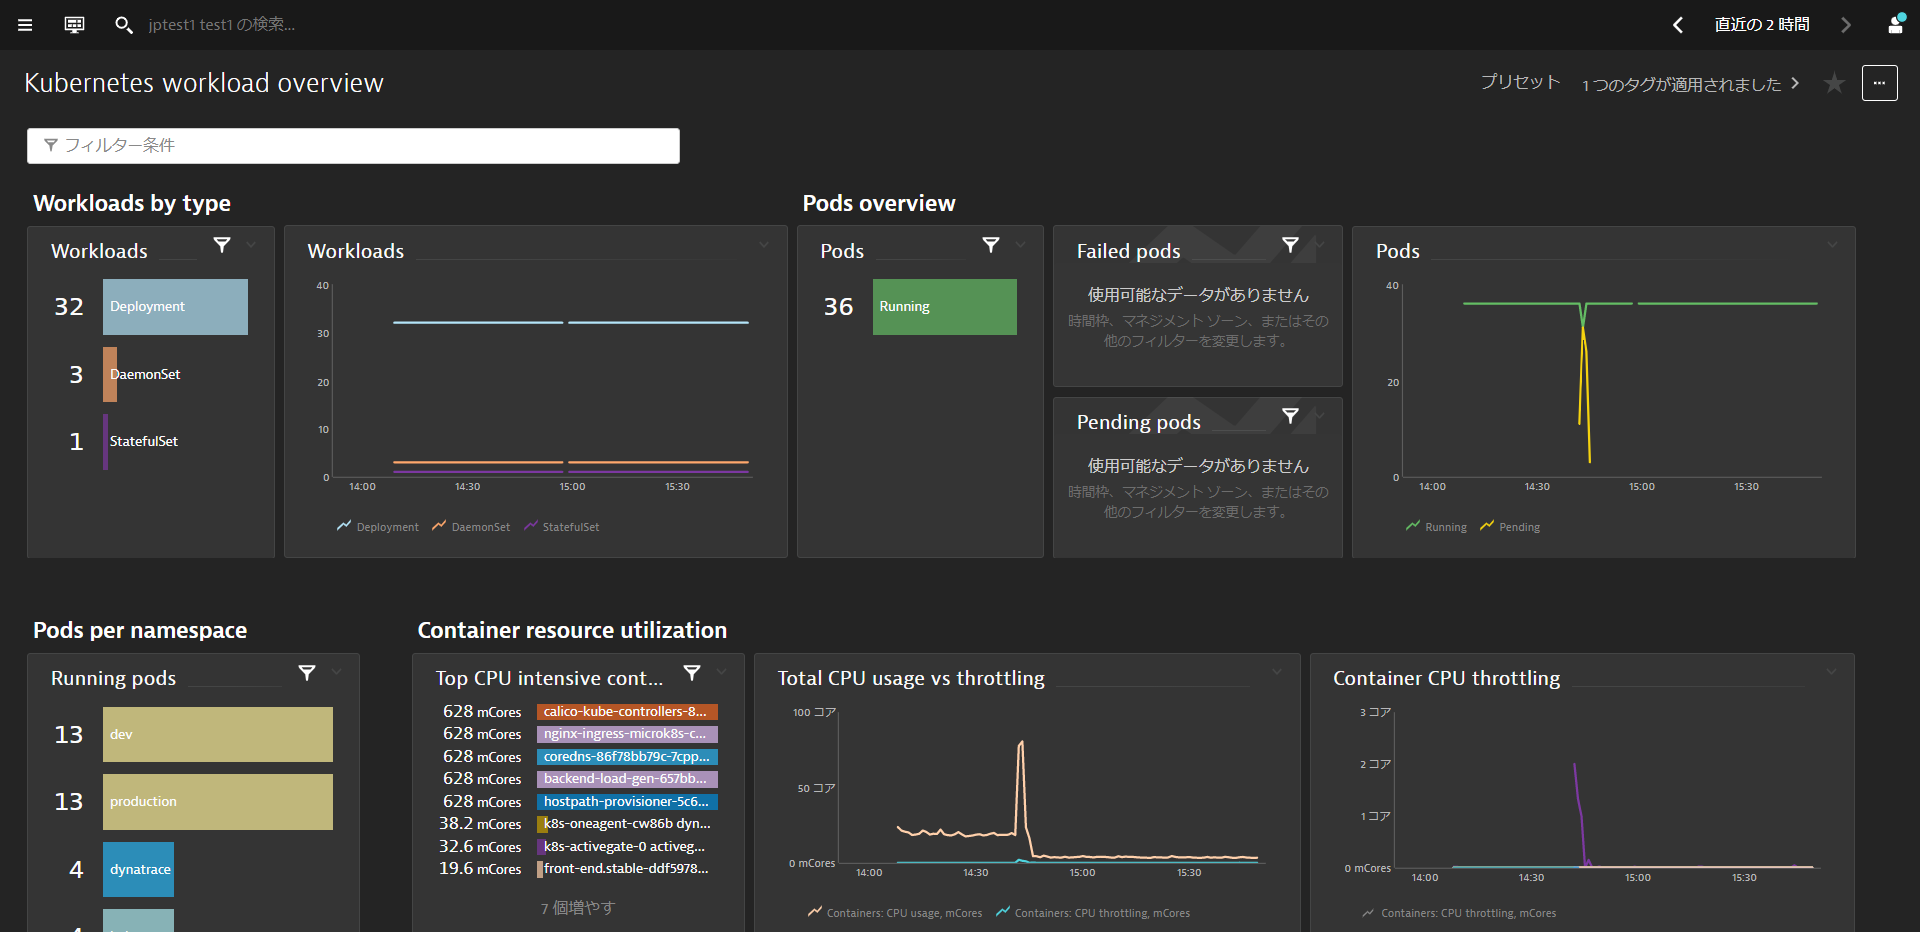
Kubernetes Workload Overview
Get an overview and understanding of the Kubernetes workload assigned to your namespaces and its usage. You could also use the filter bar to filter the dashboard.
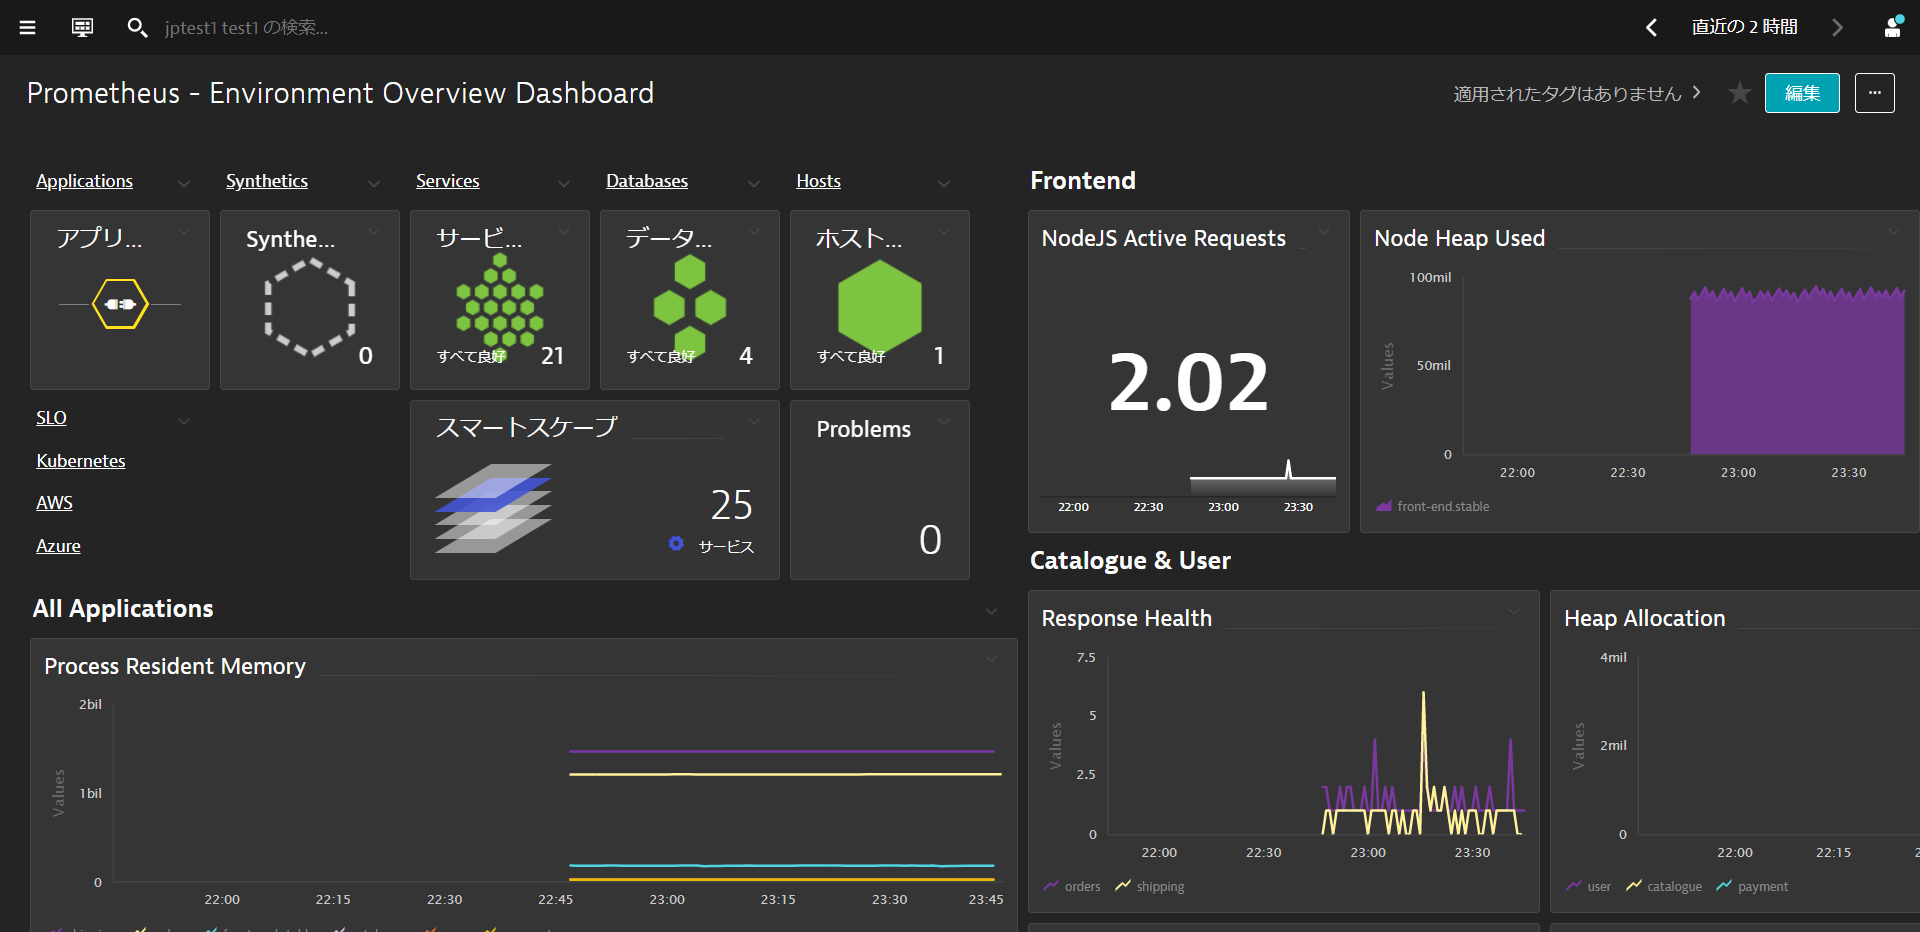
Prometheus Overview
Get an overview of the metrics collected by Prometheus within a Prometheus dashboard generated by Monaco in the earlier step.
Explore the various functionalities within the Kubernetes View such as Cluster Utilization, Cluster Workloads, K8S Events
On the Dynatrace menu, filter for Kubernetes and select the kubernetes cluster that you named. These are built-in analysis and explorative views starting from the Kubernetes cluster and drilling down all the way into the pods.
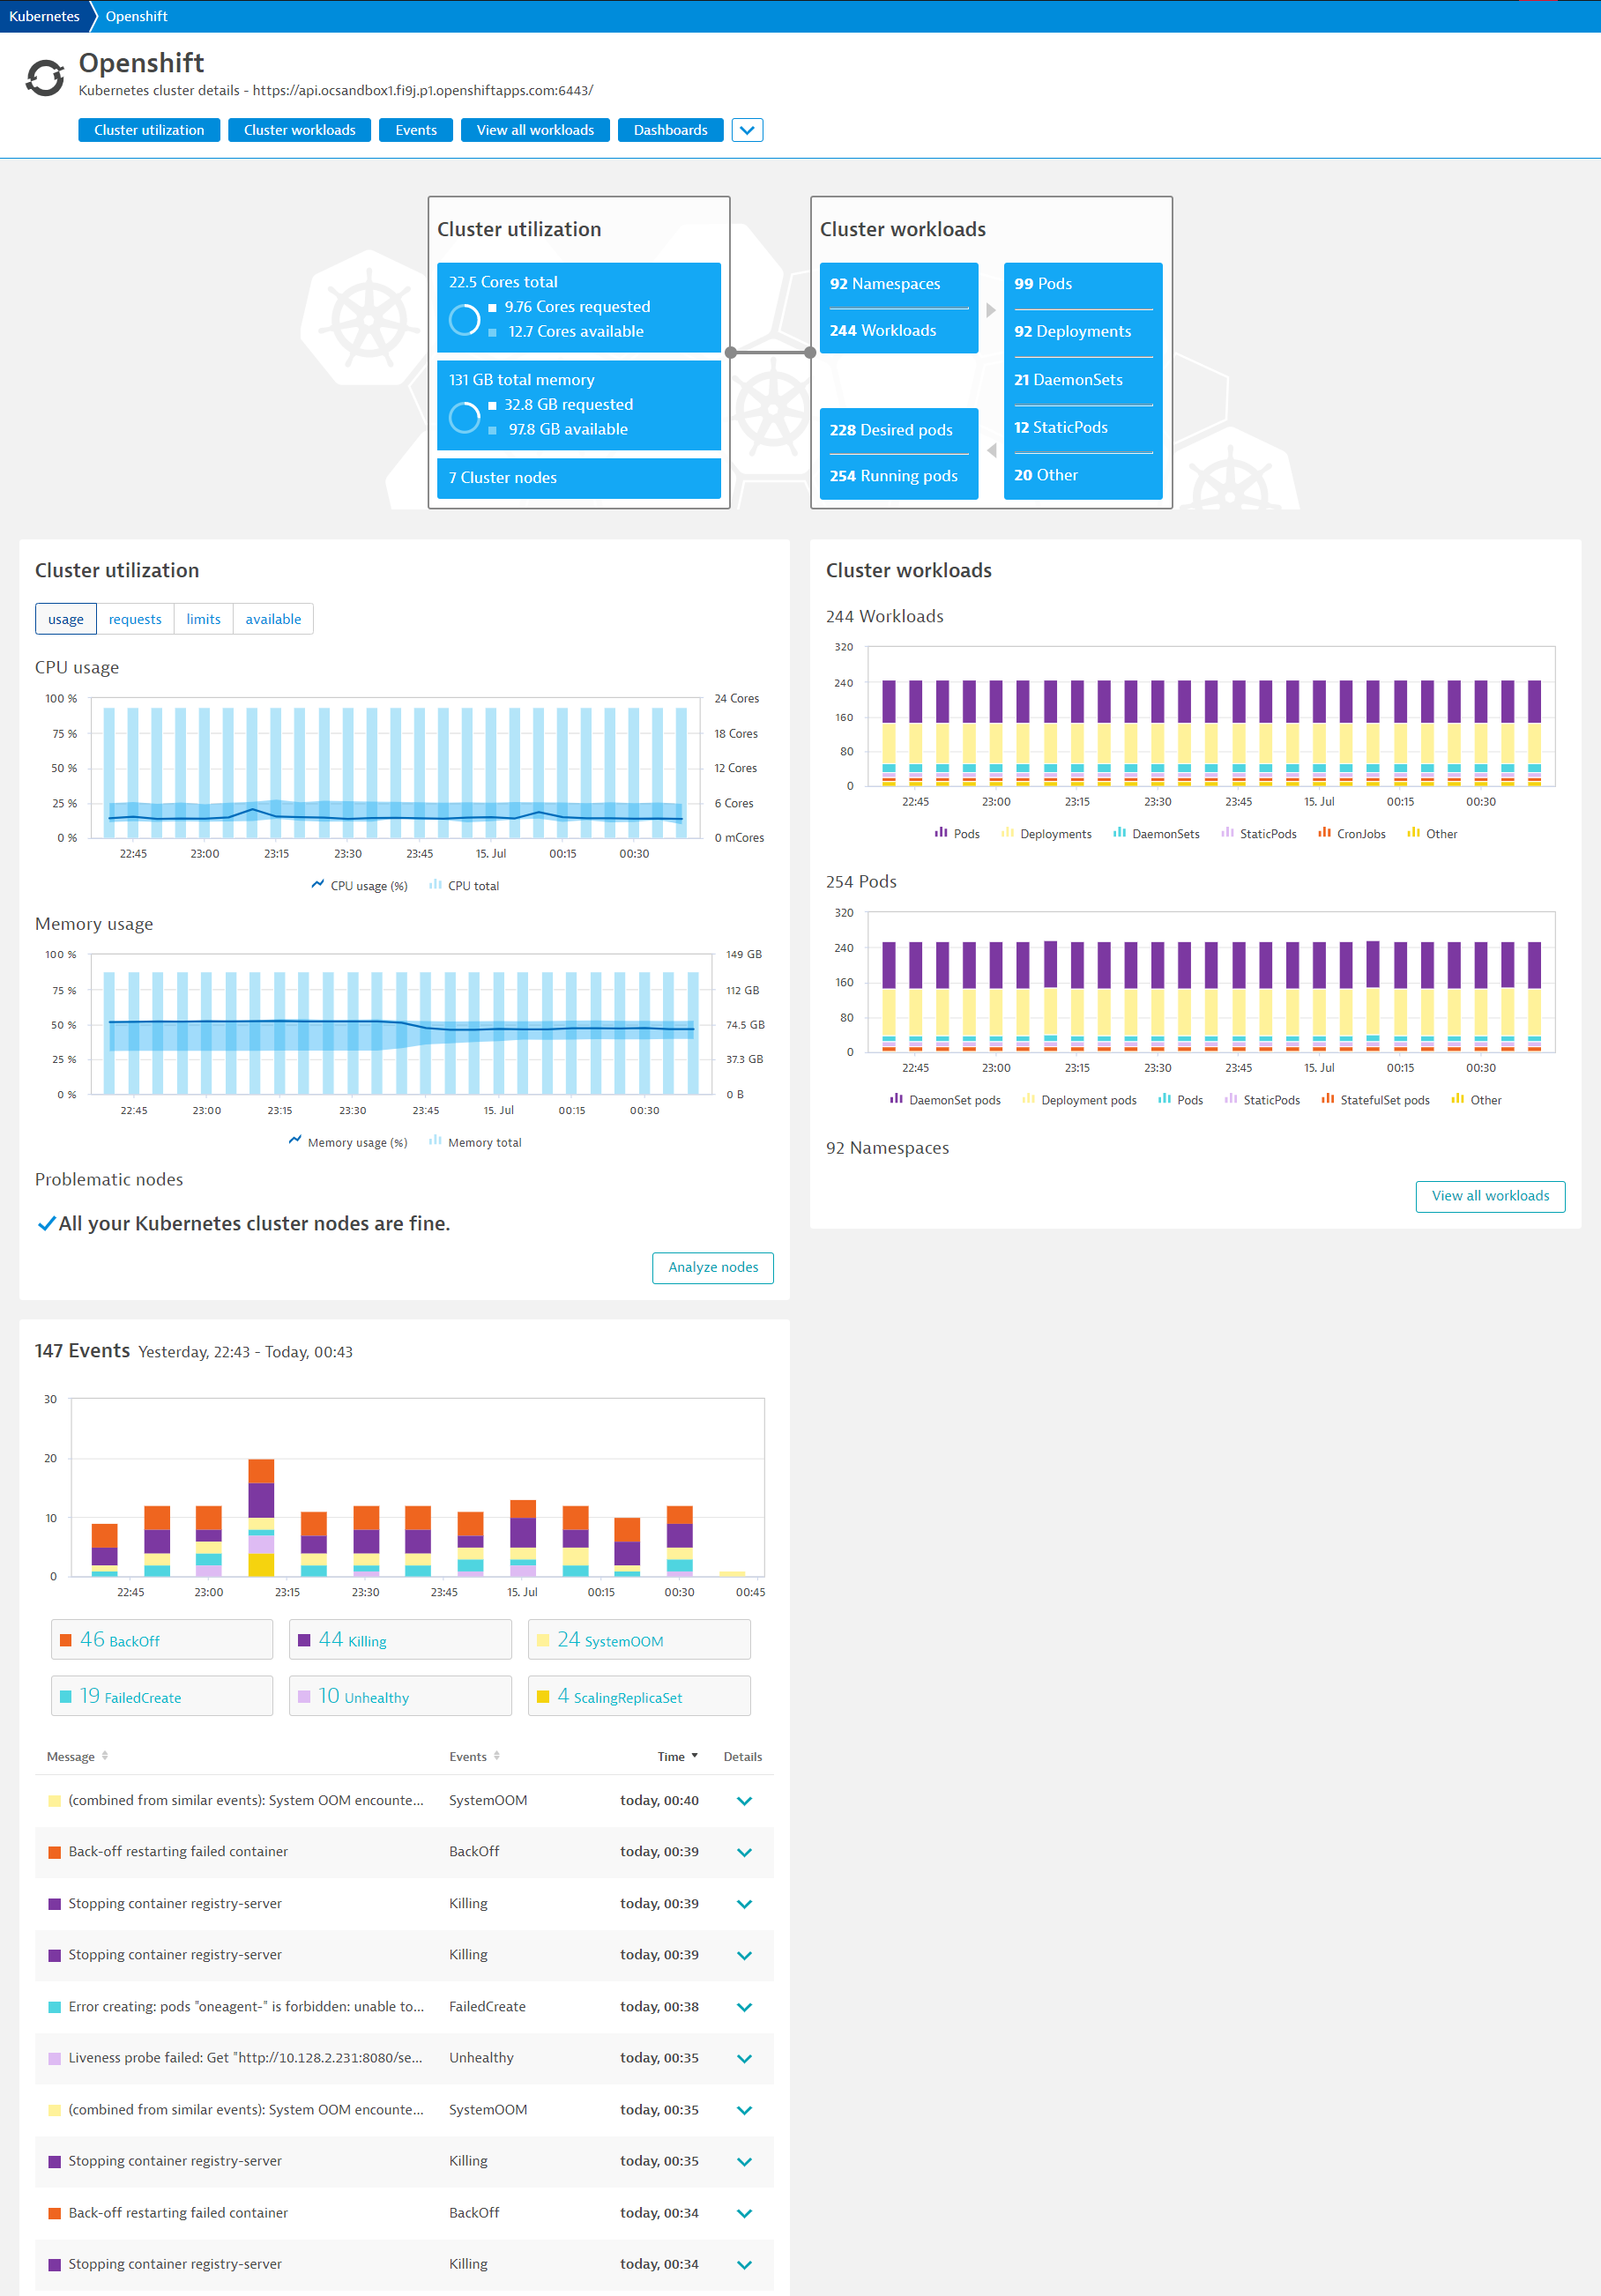
Analyze the Kubernetes Cluster utilization
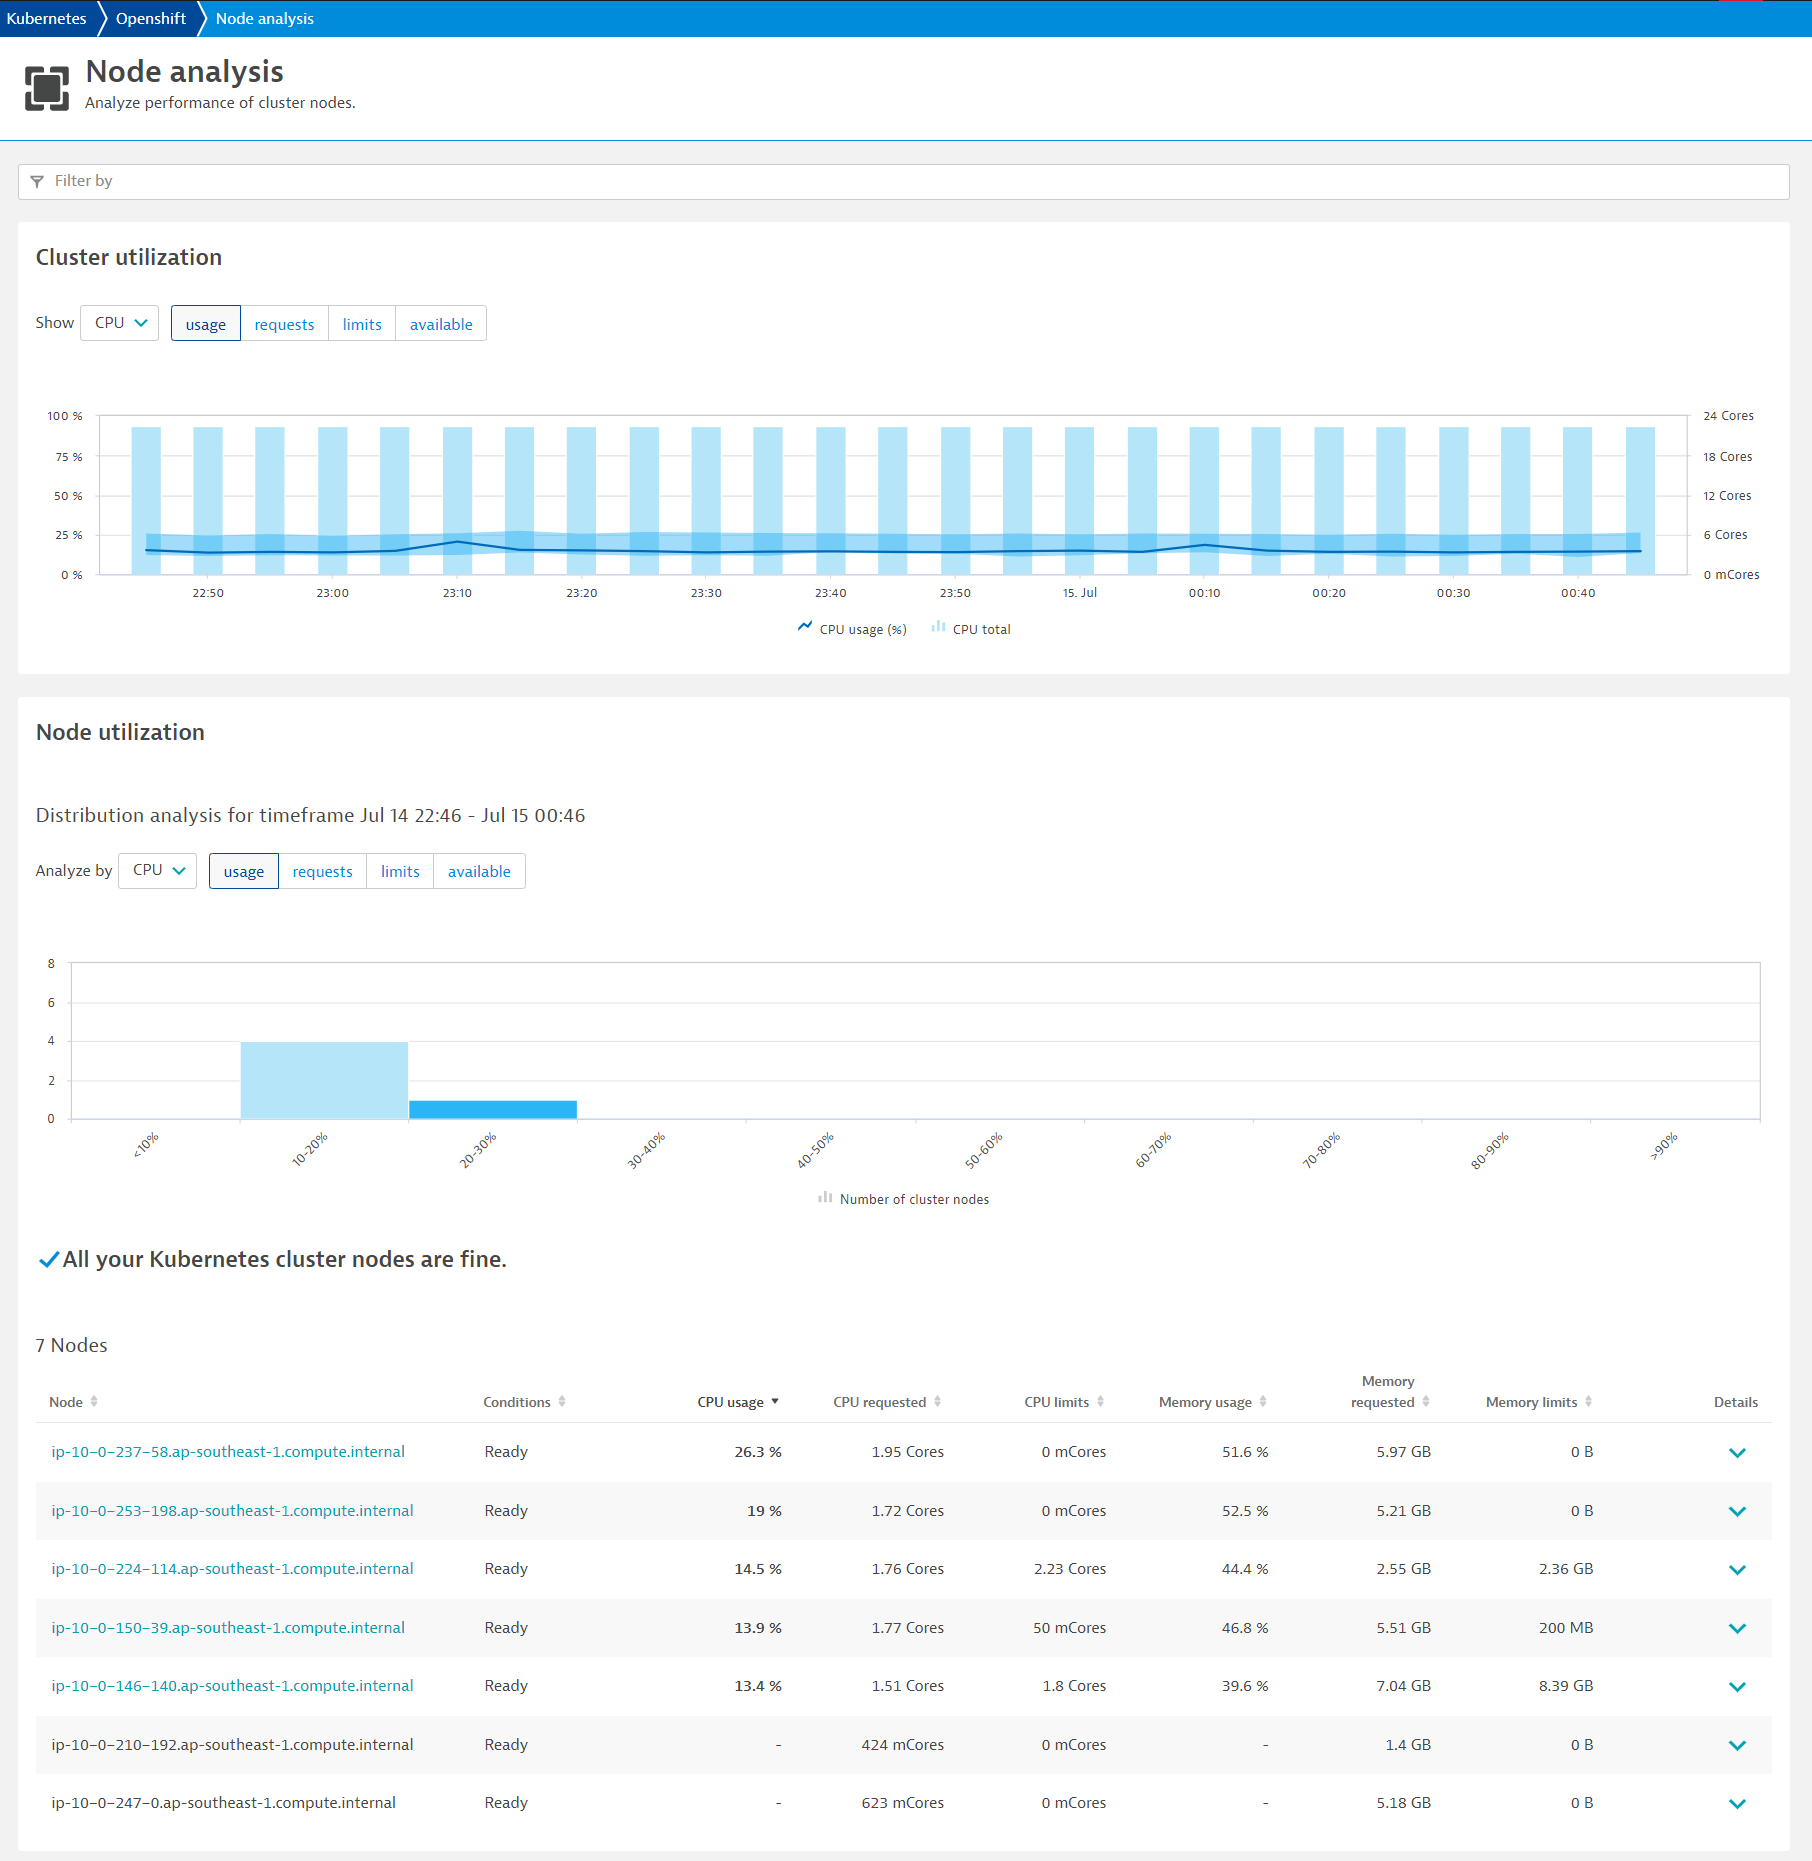
- Mouseover and note the CPU and Memory usage with the Min / Max
- Click on Analyze Nodes to drill deeper into each node
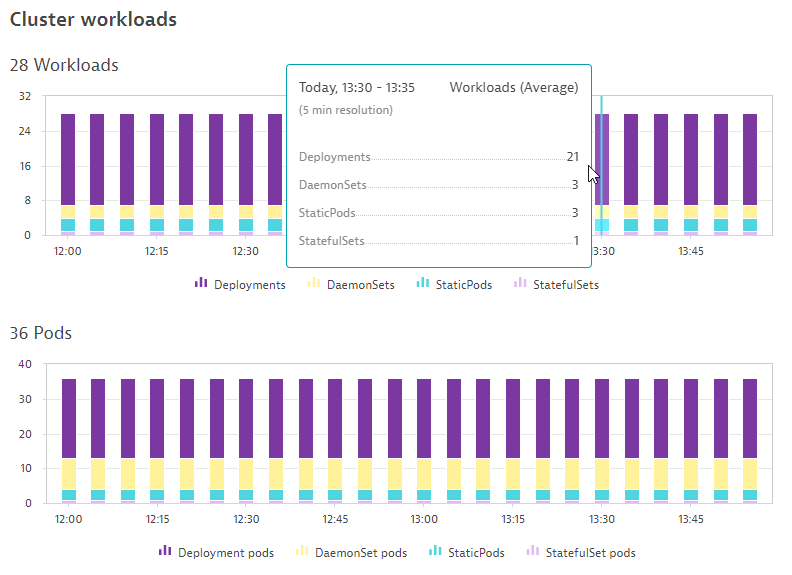
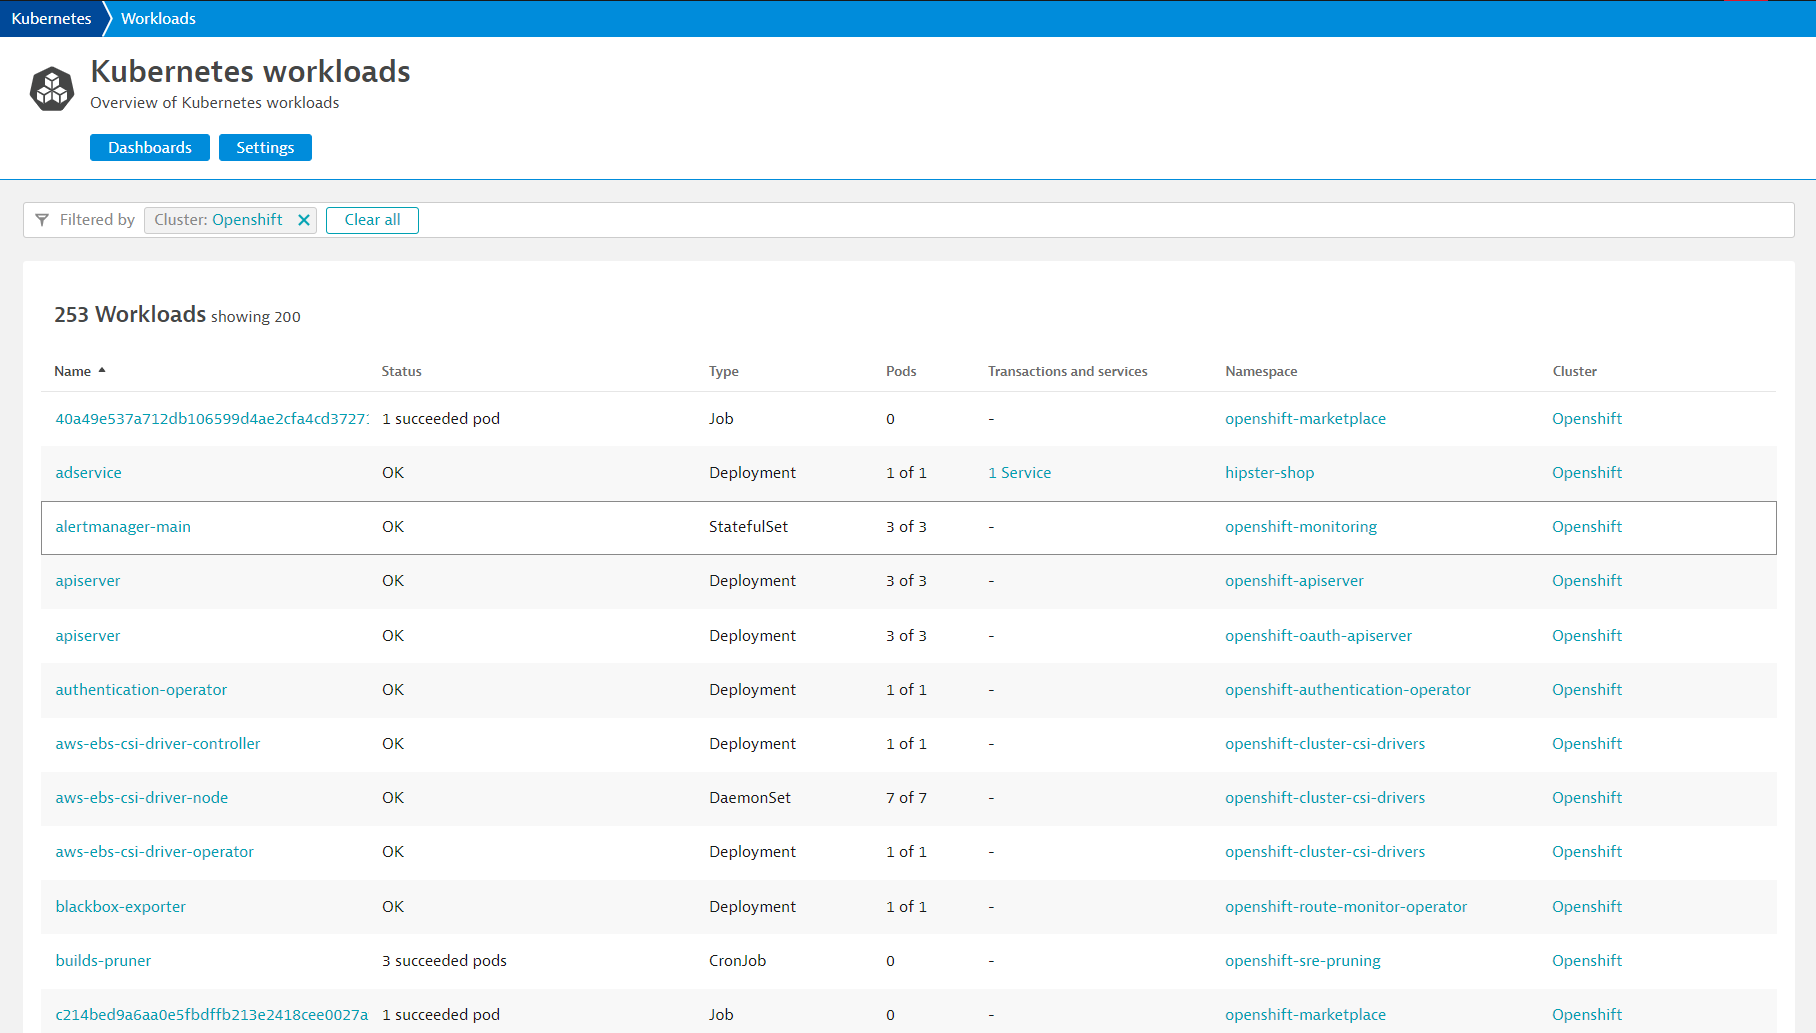
Analyze the Kubernetes Cluster Workloads
- Notice the Workloads and Pods running spilt between Kubernetes controllers
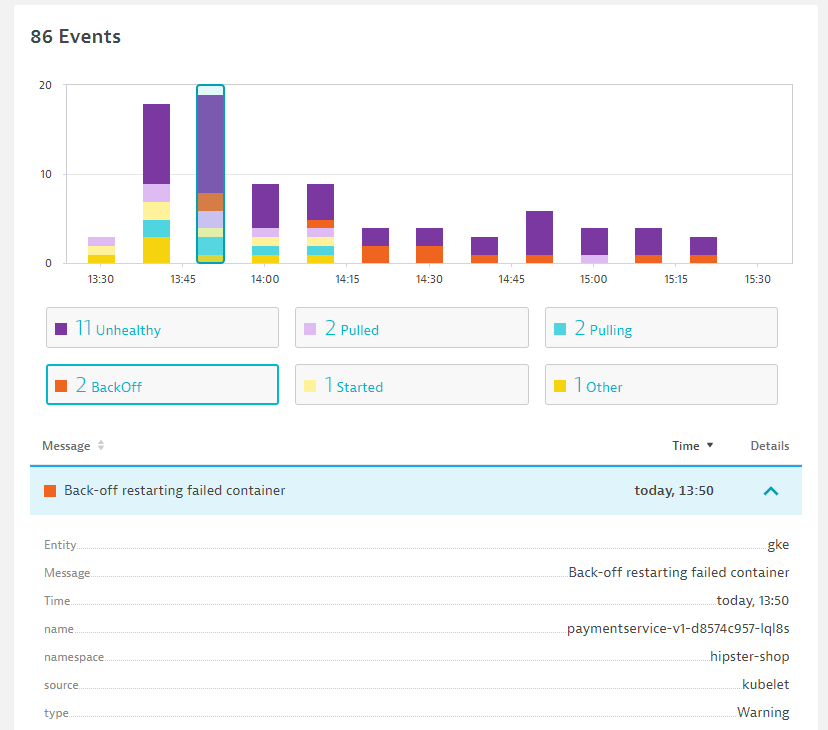
Analyze the Kubernetes Events
- Notice the different types of events BackOff, Unhealthy
Explore Kubernetes Workloads by clicking onto them
- Click onto each of them and discover their supporting technologies
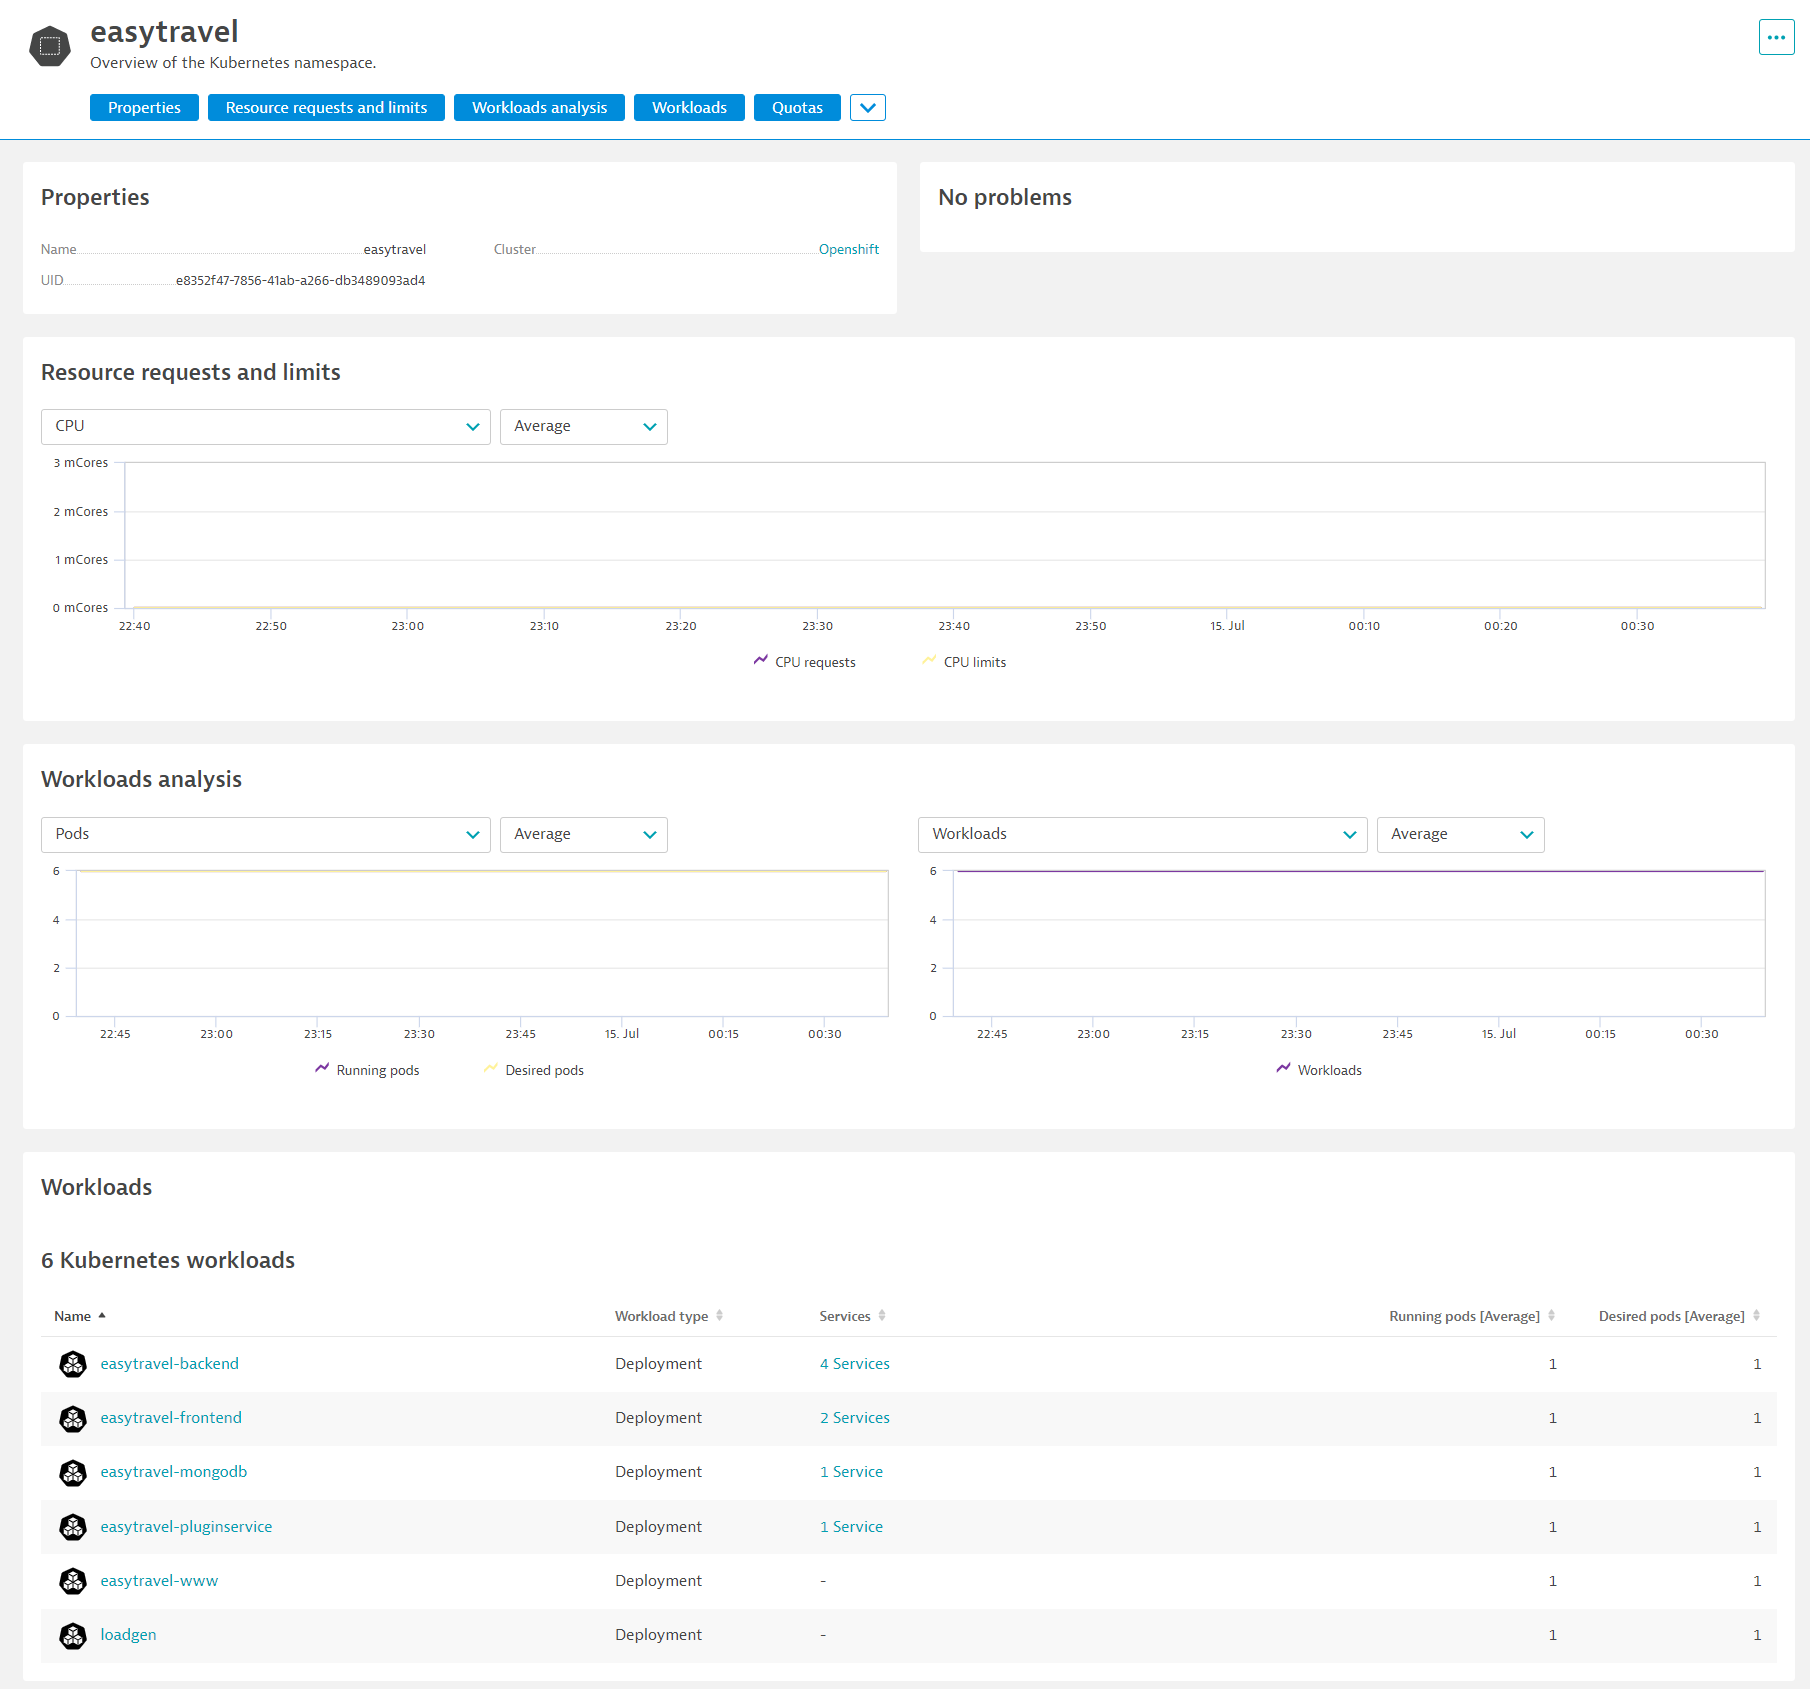
Explore Kubernetes Namespaces and their workloads
- Click onto each of them and discover their utilization and workloads
Managing your workload resource usage
Although Kubernetes platform is built on a number of virtualization and abstraction layers, you still need to be conscious of the resources that your workload is using.
This is because Kubernetes is usually designed as a platform running on shared infrastructure, so how much resources you use might affect the other applications running on the same cluster.
Scenario
- Kubernetes platform administrators set a resource quota that your project (namespace) needs to comply with
- Application team's responsibility to assign given resources to different microservices
- Apply this deployment by typing in this command:
  cd sockshop
  ./deploy_newbuild.sh
Keep an eye on your Dynatrace console... you never know what could happen.
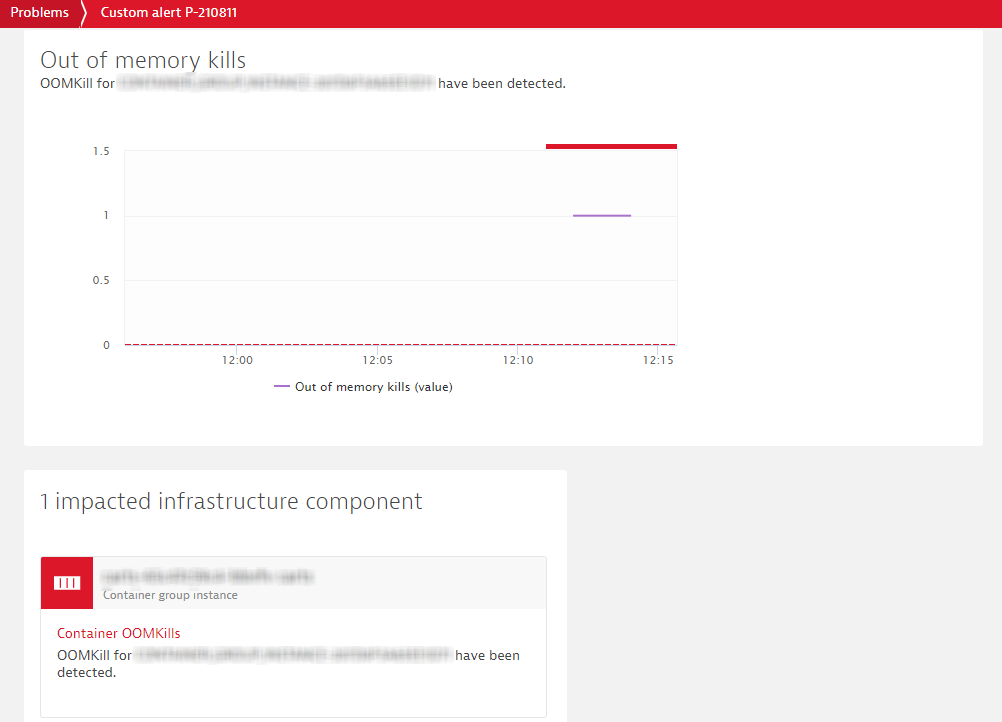
At some point, both the apps team and the k8s infra teams received an alert from Dynatrace. Let's take a look at it.
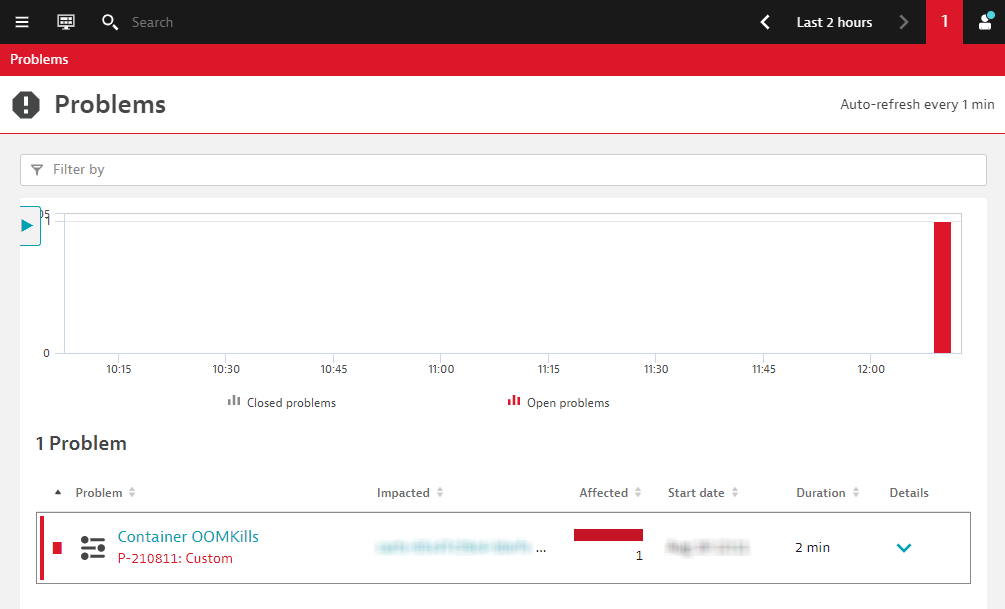
The container from the new cart service pod has been OOMKilled. This means its memory usage went above its configured limit. The thing is, before today, you never had any OOMKilled problems.
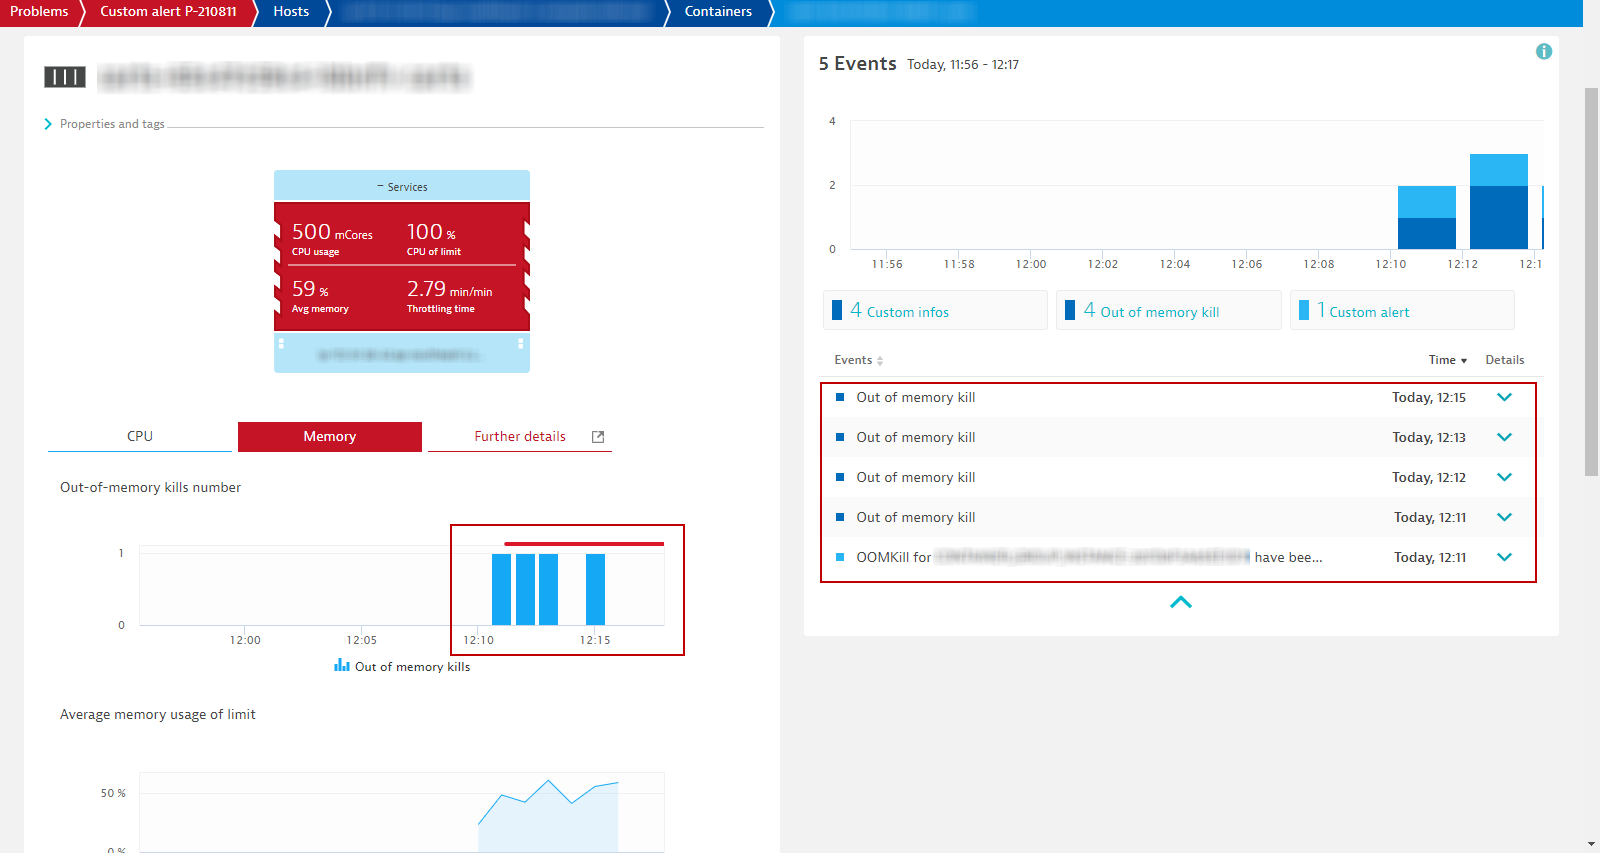
Click on the container to drill-down the the Containers view.
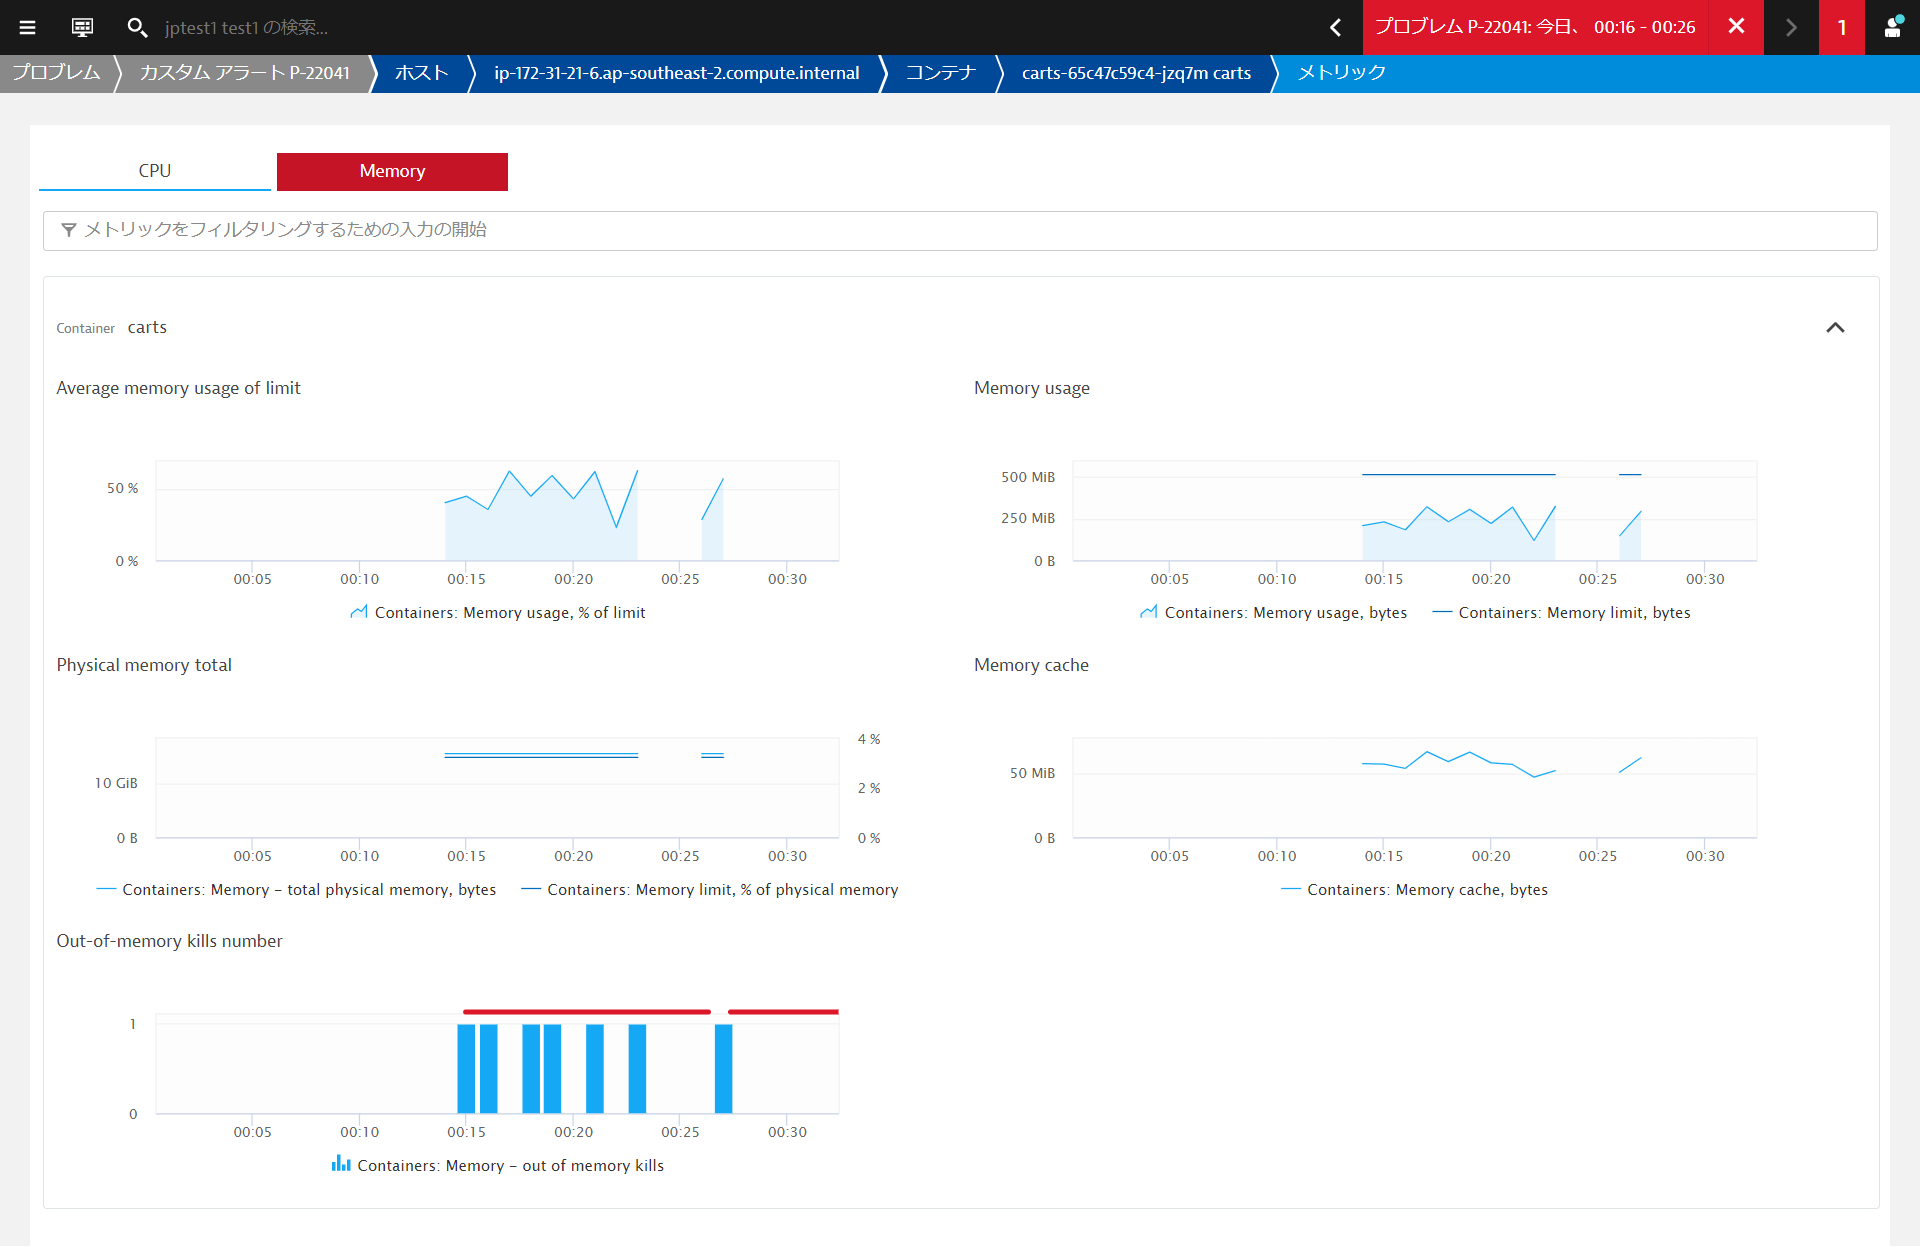
In the Containers view, you will have all the necessary metrics and data points to have a clear picture on how resources are consumed
So it has something to do with the new build. Either:
- The memory limit for the container was set wrongly, or
- The new build has a memory leak, which over time makes it consume memory above the limit.
- If that is the case, whatever the increase in memory limit, it will eventually be breached. You would just be buying time, the code itself needs to be fixed.
- Test under different conditions and monitor the Java memory metrics (in the Process view). Dynatrace will provide you all the metrics you need. Make code corrections and test again. Wash-rinse-repeat.
The dev team quickly found the issue and provided a fix. It is related to a configuration issue - The memory limit for the container was set wrongly.
In the terminal execute to apply the fix:
kubectl apply -f ~/sockshop/manifests/sockshop-app/newbuilds/newbuild-quota-fix.yml
Lesson learned
- Importance of resource management in Kubernetes
- Resources will always be limited and associated to a cost, either in infrastructure or cloud services
- Understanding workload resource consumption is key to figure out what requests and limits you have to set for your different services
Also, the k8s infra ops team will always give you only the amount of resources you need. It is their responsiblity to make sure the platform stays healthy for everyone using it. So in the case you need more resources, you have to enter into a negotiation with the platform team. And as with any negotiation, it's always better if you come at the table with as much information you can get.
And you can count on Dynatrace for that!
We hope you enjoyed this lab and found it useful. We would love your feedback!